Written By, Dr. Annjaan Dash || Training and Placement Head
Abstract :
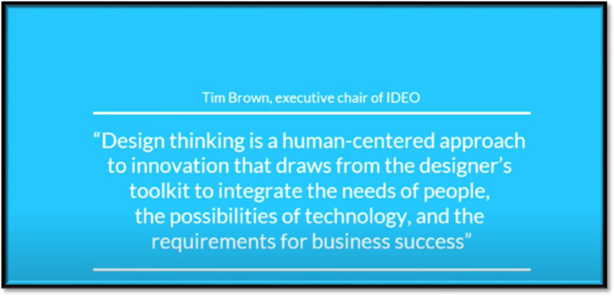
Design Thinking is an approach where the designers use the ideation process to solve complex problems pertaining to designing and design engineering. It is also instrumental for designers to find cutting-edge, tactical, and out-of-the-box solutions for customers and clients.
Design thinking is utilized abundantly in the area of healthcare and wellness, agriculture, food security, education, financial services, and environmental sustainability. It has also helped in the digital space, pitched in a lot towards the development of physical products and pressed for social innovative projects, and many more.
The iteration method of design thinking helps to entail customers and clients in momentous ways, It is not just a master plan to come up with workable solutions to a given problem, but it is also an approach to think of incredible solutions and then trying to make them not just fitting but also workable.
Design thinking is a fusion of logic, creativity, and analytical reasoning to bring the ideas that ensure solving the problems of the clients with judicious outcomes. It helps to bring innovativeness with business acumen.
Due to Globalization, there is a shift in the talent war, and due to HR Analytics HR Personnel plays a vital role in decision-making. This paper centers on training and performance appraisal metrics which are data-driven in order to improve the competencies of employees at different job roles in the organization.
Due to the Covid pandemic, there are lockdowns in different parts of the world and there is work from home opportunities to contain the spread of the coronavirus. So HR Analytics plays an important role through the application of statistics, modeling, and analysis of employee-related factors to improve business outcomes.
Keywords: Covid 19, Performance appraisal metrics, Design thinking, HR Analytics, training, and performance metrics
Source: Daash et al.,2020, J Critical Reviews
1. INTRODUCTION
Design Thinking is an approach where the designers use the ideation process to solve complex problems pertaining to designing and design engineering. Design Thinking refers to both an ideology, and mindset and refers to cognitive, strategic, and practical processes to solve complex problems in a highly human-centered way.
Design Thinking can be used by anyone to solve a problem. It involves the following:
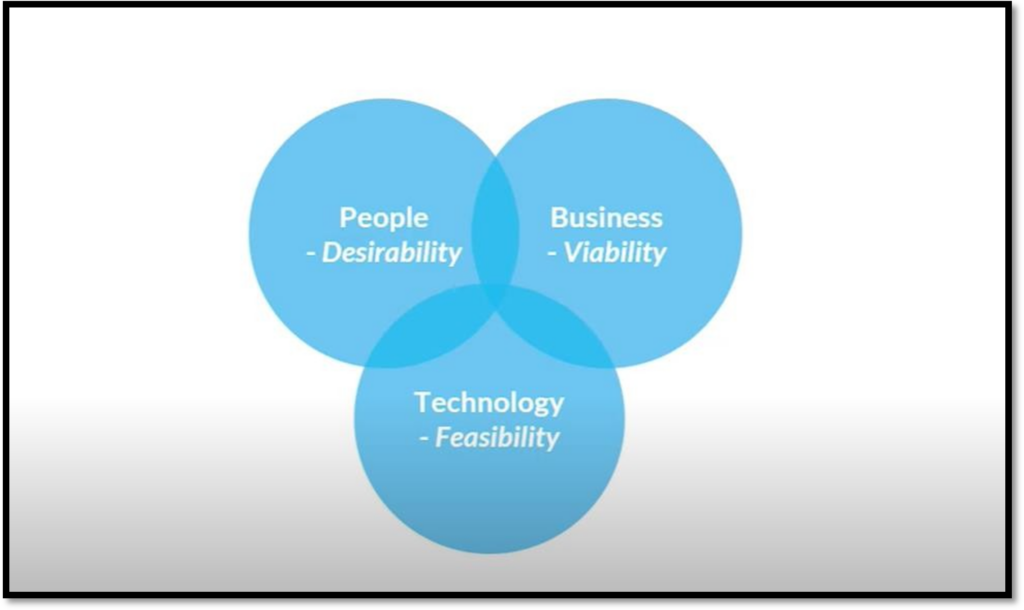
I. People Desirability
There is a need to make a solution to a problem desirable so that people always use it. It deals with how can we make things happen to take decisions. This refers to prescriptive analytics. It suggests the decision options that one can take based on predictions.
II. Technical Feasibility
Design thinkers think from the resources they have. To work on technology it is advisable for the manpower to be skilled to provide solutions through technology. Have skilled manpower to use recent technology.
III. Business Viability:
If something is not viable then it is required to redefine the solution. The business should be economically feasible.
So the main focus is on employee experience which is the core of design thinking. For ex.: Machine Learning: HR Analytics: Design thinking fits with HR Analytics and will use data for Prescriptive Analytics.
In a digital age, new digital tools can be used through HR Analytics:
- SAP
- EXCEL (Using pivot tables, graphs)
- POWER BI: VISUALIZED DASHBOARD
- PYTHON
- R TOOLS
- TABLEAU: Business Analytics
- SPSS
Core Concept of Design Thinking
It includes both the Process and the Mindset
2A. MINDSET:
Design thinking is always a human-centered approach to problem-solving.
- HR concept of the human-centered approach is a person having a problem: In HR it deals with Employee Experience.
- If you want to retain employees then it becomes imperative to offer good employee experience.
Design thinking is always a collaborative approach to problem-solving.
- Design thinkers work as a team and team members give feedback. If there is a problem they work as a team to solve it.
Design thinking is always an optimistic approach to problem-solving.
- Design thinkers see it as an opportunity.
- Ex: Shortage of skilled teachers leads to a problem
- Design thinkers view the teacher’s situation and guide them in an optimistic way where one can grow by having good opportunities.
Design thinking is experimental and iterative
- Whenever we design something, we do it in iteration which means short spells (Day/ week)
- Every iteration we experiment new type of solution.
2B. THE PROCESS OF DESIGN THINKING: PART 1
It is a nonlinear ( we can go back to the previous step) iterative process that looks forward to understanding different users and challenges.
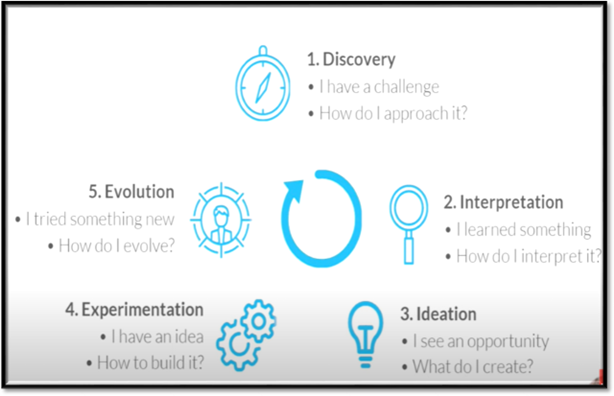
Discovery Phase:
Design in an optimistic way. We need to talk to different users by distributing questionnaires/ surveys to understand the challenge.
Interpretation Phase:
How as a team one interprets the information gathered from the Discovery phase. Then we need to understand the problem which leads to the foundation of solutions.
Ideation Phase:
It deals with generating ideas. See the opportunity and brainstorm what to create to fill the gap. Stimulus schema: Choose the best alternatives by working in a team.
Experimentation Phase:
Bridge the gap with feedback
Evolution Phase:
New Things learned. Change for the better
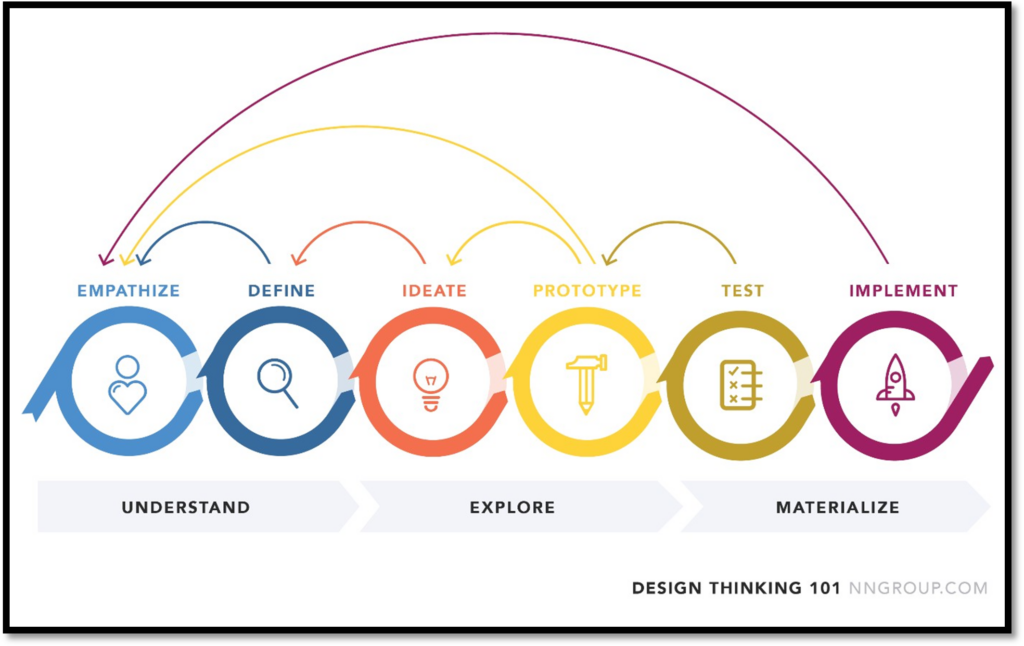
2C. THE PROCESS OF DESIGN THINKING: PART II
Source: https://www.interaction-design.org/
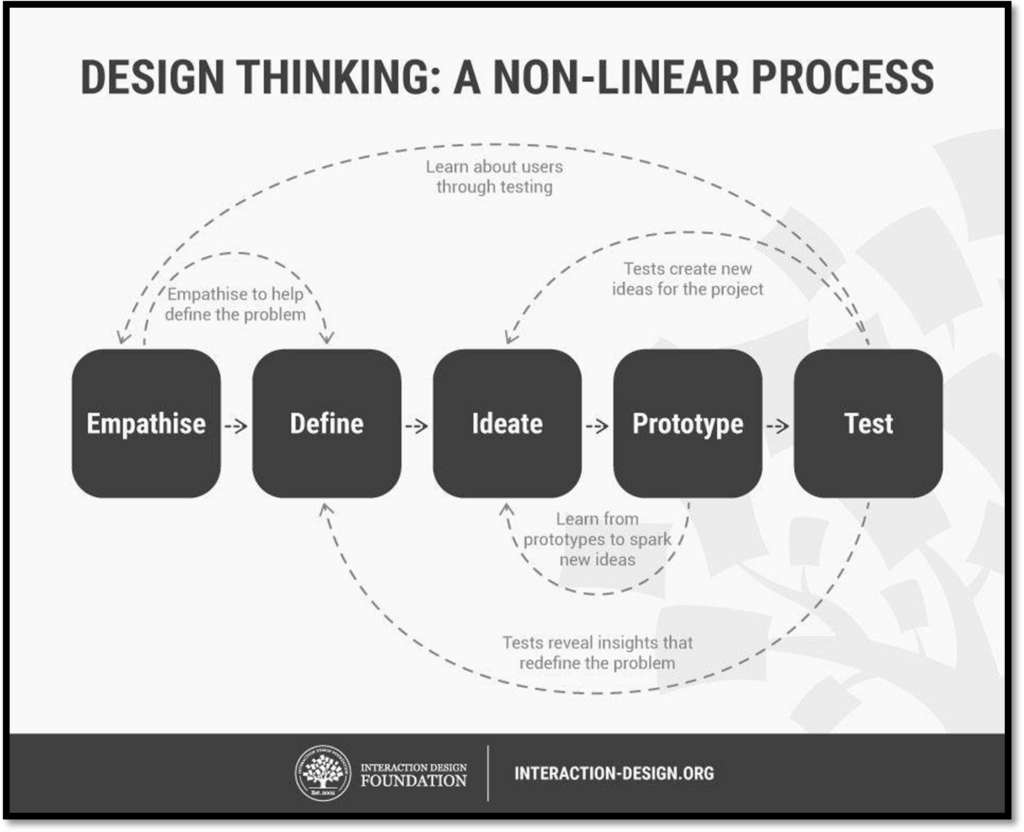
Empathize > Define > Ideate > Prototype > Test
1. Empathize
The first step of design thinking is to understand the problem from the perspective of the end user. Tools that a Training professional can use to put themselves in the shoes of learners include personas, empathy maps, focus groups, and interviews.
2. Define
The next step is to frame the problem discovered during the empathy phase as a design challenge that we can then work toward solving.
3. Ideate
Here, L&D professionals can use workshops, whiteboarding, and mind mapping to begin identifying possible solutions to the design challenge posed in the previous phase.
4. Prototype
A prototype is a preliminary version of one of the solutions identified in the ideate phase. Prototyping enables L&D professionals to quickly test out new approaches without significant resource or time investments.
5. Test
This phase is all about testing out the solutions identified with end users, gathering feedback, and adjusting as necessary.
3. Why Design Thinking in HR? DELLOITE:
Design Thinking casts HR in a new role. It transforms HR from a “process developer” to an “experience architect”. How people meet, and interact, how managers spend time, and how companies select and train people.
Design thinking looks after the day-to-day activities and operational requirements of HR
Research by IBM:
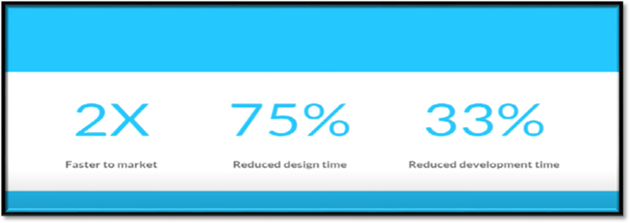
Faster to Market:
Designers get products to the market 2 times faster
Reduced Design time:
The time that it takes to design an intervention is reduced by 75%
Reduced development time:
Developing time is reduced by 33% as a team
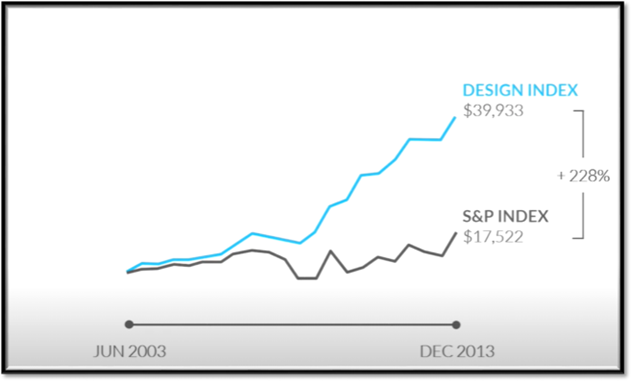
Research group DMI with Motive strategy in 2014 looked at different companies that have applied design thinking.
4. COVID-19: The Role of HR Analytics in Analysing the Performance Appraisal Metrics
Source: https://www.gallup.com/
Employee Performance Management is crucial for all organizations, as it is one of the key drivers for organizational success. But many organizations often confuse or mix it with an annual performance review or a performance appraisal.
According to a Gallup survey, the percentage of workers who say their employer offered them flexitime or remote-work options grew from 39 percent in mid-March to 57 percent by early April.
Additionally, 62 percent of employed Americans say they’ve “worked from home during the crisis, a number that has doubled since mid-March,” according to Gallup.
HR analytics helps employers identify skill gaps and provide training programs to improve them using data-driven analytics. With the usage of HR Analytics, there is proper analysis of employee-related factors to improve their performance
Performance Gap: The gap between delivery and expectation is the performance
Positive Gap: Delivery exceeds expectations
Negative Gap: Delivery is less than expectation
Ex.: Suppose one has to sell 100 credit cards in a month; but was able to sell 85 credit cards: Negative Gap. Gap Calculation: It is a numeric expectation or a numeric delivery
• We have to set the targets or benchmark then go for delivery
• Ex.: If you get good marks you will get a certificate ( What is good: Define it say 80%: target)
4.1 KEY PERFORMANCE INDICATORS (KPI)
We need Key performance indicators irrespective of the business we are doing. Performance evaluation is done to determine the success level of an organization, a project, or a product.KPIs do not only keep track of actual level actions and at the same time it can be used to audit performance against future goals. In simple words, KPIs help in knowing the performance output of an individual against set targets.
The different performance levels of KPIs :
- Strategic:
KPIs at a strategic level help the organization in keeping track of its performance against future business goals, ex: growth - Operational:
Operational KPIs are allied to strategic KPIs but it concentrates on different departmental activities like product development, and marketing. This can be used to take daily management decisions - Individual:
It is used to check the level at which the employees are executing their skills in their tasks. They can also be utilized by their supervisors as a tool for appraisal which can be linked to the remuneration in their departments.
| S.No. | Key Result Area | Key Performance Indicators |
| 1 | What to do? (Texts) | How much to do? Number related to KRA |
| 2 | Job Responsibilities | Monitor performance against set objectives |
| 3 | Qualitative | Quantitative |
| 4 | Customer Care Exec Outbound callsResolve customer query | 50 calls/ day * 80% of queries must be resolved. |
4.2 Designing HR Balanced Scorecard
Source: *Adapted from Robert S. Kaplan and David P. Norton, “Using the Balanced Scorecard as a Strategic Management System,” Harvard Business Review (January-February 1996): page 76.
BSC is a performance management framework used by decision-makers to monitor the accomplishment of key activities. It is also used to monitor progress toward the organization’s strategic goals. It is a management technique that is used to provide both internal and external perspectives of the organization.
Ex of BSC: SWOT analysis, IFE matrix, EFE matrix, BCG matrix, and SPACE matrix.
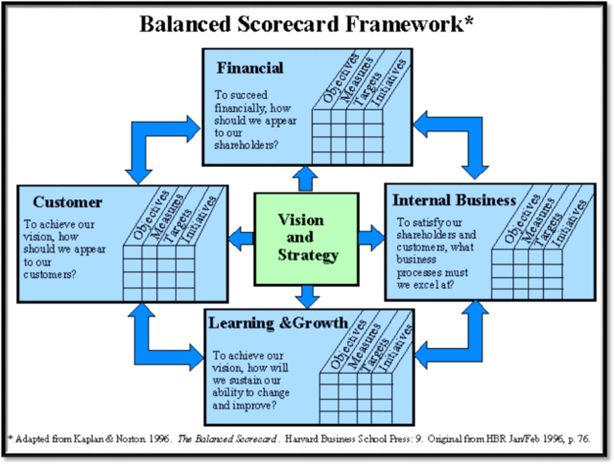
Perspective 1: Customer
“How well are we meeting the needs of our customers, and how can we make them more satisfied?“ Whether job responsibilities have an impact on customer experience: Yes or No: If Yes: It’s a part of BSC.
Perspective 2: Internal business process
“How do our internal processes function to efficiently deliver products and services, and how can we improve our efficiency?”
Whether job responsibilities have an impact on internal process/ efficiency: Yes or No: If Yes: It’s a part of BSC.
Perspective 3: Learning and Growth
“How well are we positioned to ensure that goals are met in the future?”
Whether job responsibilities have an impact on increasing the knowledge of the employees: Yes or No: If Yes: It’s a part of BSC.
Perspective 4: Finance
“How well are our finances managed to achieve our mission?”
Whether job responsibilities have an impact on the company’s revenue: Yes or No: If Yes: It’s a part of BSC.
Balance Scorecard Metric Metrics:
Balance Score Card:
| S.No. | Performance Metrics | Metric Weigh (%) | Worst Case Performance Range | Best Case Performance Range | Your Performance | Metric Score (%) | BSC (%) |
| 1 | Inbound Contact | 20 | 3 | 65 | 10 | 11.29 | 2.26 |
| 2 | Customer Satisfaction | 25 | 5 | 45 | 5 | 0 | 0 |
| 3 | Technology utilization | 25 | 7 | 23 | 15 | 50 | 12.5 |
| 4 | Query resolution | 5 | 23 | 77 | 45 | 40.7 | 2.03 |
| 5 | Job satisfaction | 15 | 45 | 45 | 45 | 0 | 0 |
| 6 | Call ans. In 30 sec | 10 | 6 | 12 | 10 | 66.6 | 6.67 |
| Total | 23.47 |
Step 1: Select 6 critical performance metrics
Step 2: Weigh each metric as per importance
Step 3: Record the highest and lowest performance level
Step 4: Record the actual performance of each metric
Step 5: Interpolation: [(Worst Case – Actual Performance) / (Worst case – Best Performance)]*100
- Parameter 1: [(3-10) / (3-65)]*100 = 11.29 %= metric score : BSC: metric score * metric weight : 11.29%20= (11.29/100)20 = 2.26
- Parameter 2: [(5-5)/5-45)]*100=0= metric score: BSC: 0
- Parameter 3: [(7-15)/7-23)]100=50%= metric score:BSC: 50%25 = 12.5
- Parameter 4: [(23-45)/23-77)]100 = 40.7% = metric score: BSC: 40.7%5=2.03
- Parameter 5: 45-45: 0: metric score: BSC: 0
- Parameter 6: [(6-10)/6-12)]100=66.6% =metric score: BSC: 66.6%10=6.67
4.3. 360 Degree Feedback
360-degree feedback is another tool to measure employee performance. To assess an employee’s score, his peers, subordinates, customers, and manager are asked to provide feedback on specific topics. This feedback often represents an accurate and multi-perspective view of an employee’s performance, skill level, and points of improvement. It is multi-rater feedback.
| Quality | Manager | Peer | Customer | Sub Ordinates | Total | Avg. Score |
| Helping nature | 3 | 4 | 2 | 3 | 12 | 12/4=3 |
| Learning | 4 | 5 | 5 | 4 | 18 | 18/4=4.5 |
4.4 Profit per FTE
Profit/ Employee: (Business Profit) / Number of employees Business Profit: Total revenue – Expenses
A high Profit/FTE indicates the organization’s financial healthiness
Ex: Case:
Emt: Rs 1,00000/- (Income – Investment/ expense) No. of employees: 10
So Profit/employee: 100000/ 10 = Rs 10,000/-
| Company 1 | Company 2 | |
| No. of employees | 500 | 300 |
| Profit | 500000 | 500000 |
| Profit/ employee | 1000 | 1666.7 |
| Effective |
4.5 Absenteeism Rate:
Source:https://www.gallup.com/workplace/236927/employee-engagement-drives-growth.aspx
Highly motivated and engaged employees take in general fewer sick days (up to 37% less, according to Gallup). Additionally, absent employees are less productive, and high absence rates throughout an organization is a key indicator of lower organizational performance.
Absenteeism: No. of days missed / total no. of scheduled working days.
Factors of Evaluation:
• Number: Number of employees remaining absent
• Unit: Number
• Turn Around Time (TAT): Period of absence
• Relation wrt Company’s profit(Y/N) : N
• Measurable (Y/N): Y
Absenteeism: [ (Average no. of employees * Missed working days) / Avg. No. of employees* Total working days] *100
Ex: Case:
1st Jan to 31st March Total working days: 78
Total no. of absent days: 12
Average no. of employees= Beginning 1st Jan: 80, End : 31st March : 84: 164/2 : 82 Avg. no. of absent days : 12/82 : 0.14
Absenteeism rate : (820.14)/ (8278) = (11.48/6390)*100 =0.17
4.6 Forced Ranking (Bell Curve):
o Ranking employees by a list from best to worst employees based on their performances
o Employees are analyzed with each other and assessed on their performance
o Bottom 10% workforce gets fired / action is taken
Forced Ranking: (10/100)Number of employees o Suppose an organization has 50 nos. of employees Forced Ranking: (10/100)50 = 5 employees will be replaced.
o It helps create strong performance-oriented culture. Employees who perform well are rewarded.
o Introduced by GE
4.7 Human Capital / ROI:
o It assesses the value of human capital that is knowledge, habits, and personal attributes
o Total Revenue – Total Expense / No. of manpower Case:
Total revenue: Rs 30,00000/- (quarter) Expense: Rs 22,00000/-
Average manpower: Beginning strength + End period strength : (26+28)/2 = 27 Human Capital/ROI = (30 lacs – 22 lacs)/27 – Rs 29,630/- per employee
Cost related to employees is considered here.
5. Training and Development Metrics
• Training & Development: It is an art to increase the knowledge, skills & abilities of the employees to do a particular job.
• Training offers a competitive advantage to an organization by removing performance deficiencies; making employees stay long; meeting future employee needs, and minimizing accidents.
• Employees become efficient after undergoing training which contributes to the growth of the organization.
5.1 Training expenses per employee/ Training Cost per Employee:
Training expense: Total training expense / Total no. of employees who received training
| S. No. | Purpose | Cost (Rs) |
| 1 | Training fees | 15000/- |
| 2 | Venue Cost | 5000/- |
| 3 | Travel cost | 5000/- |
| 4 | Food cost | 4000/- |
| Total Cost | 29000/- |
Total training cost: Rs 29,000/-
Total no. Of employees: 20 (avg. employee strength for that period
So, Training cost/employee: 29,000 / 20 Rs 1450/- per employee.
Factors of Evaluation:
- Number: Amount
- Unit: Rs
- Turn Around Time (TAT): Total training duration as per training calendar. 1 week/ 1 day
- Relation wrt Company’s profit(Y/N) : Y
- Measurable (Y/N): Y
5.2 Training efficiency: Training Return On Investment (ROI):
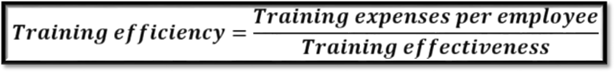
Training ROI = (Cost of employee Training / Value of increased performance) *100
Training ROI =(Cost of employee Training /(Performance before Training – Performance after training)
We refer it as KPI
Case:
| Avg. No. of Employees | Avg. Performance Turnover(Rs) | Avg. Training Cost (Rs) | Avg. per head Performance turnover(Rs) | Avg. per head Training cost | |
| Past | 25 | 10,00,000 | 35,000 | 40000 | 1400 |
| Current | 25 | 11,00,000 | 45,000 | 44000 | 1800 |
| Past Vs Current | 100,000 increased | 10,000 increased | 4000 increased | 400 inc |
Note:
• Avg. per head performance turnover = 10,00,000/25 = Rs 40,000; 11,00,000/25=Rs 44000/-
• Avg, per head training cost: 35,000/25 = Rs 1400; 44000/25 : Rs 1800/-
Observation:
Spending 400 extra on training cost company gets Rs 4000/- performance turnover
Factors of Evaluation:
- Number: Amount
- Unit: Rs
- Turn Around Time (TAT): Total training duration as per training calendar. 1 week/ 1 day
- Relation wrt Company’s profit(Y/N) : Y
- Measurable (Y/N): Y
5.3 Training Participation Rate:
It helps to determine if the “right” type of training is getting offered, the best delivery medium is being used or whether opportunity has been effectively communicated or not.
Training Participation Rate = (No. of employees participated / No. of employees nominated)*100
Case:
| S.No. | Training | Nominated | Participated |
| 1 | Excel | 100 | 80 |
| 2 | Communication | 100 | 100 |
| 3 | Email ettiquate | 150 | 100 |
| Total | 350 | 280 |
Nomination :
(280 / 350)*100 = 80%
Voluntary participation: Open Training:
(280/500)*100 = 56%
Note: The internal trainer is liked then the participation increases. Gives an idea about the feedback of the trainer.
6. CONCLUSION:
The breakneck transmission of the coronavirus and the disorderly and anomalous response of many governments demonstrates how vulnerable we are in dealing with a global pandemic. No one looked at the COVID-19 outbreak as a design problem, but the crisis offers a chance to question the wisdom of old habits and explore out-of-the-box thinking. Applying the design thinking process, designers and design thinkers can play a vital role in diagnosing the most pressing issues and coming up with solutions.
Tumult and upheaval have altered history with wars, plagues, and chaos, sometimes leading to positive growth. We can look for a silver lining in the current calamity: COVID-19 is forcing the world to rethink its outmoded routines and power a remarkable pace of design innovation. Many design breakthroughs of the current crisis will be short-lived, but many will have staying power because they solve big problems. It’s up to designers to get to work.
Design thinking not only helps to come up with innovative solutions but also helps to address the exact problems faced by the customer and target the customer’s requirements in the best possible manner.
7. REFERENCES:
- Daash et al.,2020, J Critical Reviews, 2690-2699, IMPORTANCE OF HR ANALYTICS IN THE ERA OF 2020 POST COVID-19
- https://www.shrm.org/resourcesandtools/hr-topics/people-managers/pages/performance-reviews-during- coronavirus-.aspx
- www. nngroup.com
- https://www.interaction-design.org/