
Written By, Dr. Annjaan Dash || Training and Placement Head
Abstract
We are now residing in an era that can be labeled as the Era of Analytics. HR Analytics is now playing a vital role in aligning all the business processes toward the achievement of strategic goals in order to have a competitive advantage. Additionally, the globalization of business has escalated the motion of employees in the organization and there is cultural amalgamation on social and corporate levels.
Hence there is a shift in the talent war, where HR plays a pivotal role in human capital analytics for business decision-making. This would result in changes in recruitment practices across organizations throughout the world to acquire fresh talents and better decision-making capacity with the help of workforce analytics.
This paper focuses on recruitment and attrition analytics by utilizing data-driven metrics and acumen to upgrade the sourcing of the best candidates for different profiles within the organization and understand the reasons for the gradual loss of employees over time and how to retain them in the organization.
Due to the pandemic COVID-19, organizations have been scrapping interviews. It is to be expected that 60-65 percent of interviews would get dropped or delayed due to lockdowns in many parts of the world and people are encouraged to stay at home to curb the spread of the virus.
This will witness an adverse impact in the short term with interviews getting postponed, especially in the services sector, following the slowdown across industries triggered by the coronavirus pandemic. Subsequently, due to the coronavirus pandemic, there is a severe economic slowdown so organizations have opted for work from home using technologies. So, HR Analytics plays an important role in retaining employees and improving ROI.
I. Introduction
HR analytics is the utilization of statistics, modeling, and analysis of employee-related factors to boost business outcomes. HR analytics can also be attributed to:
- People analytics
- Talent analytics
- Workforce analytics
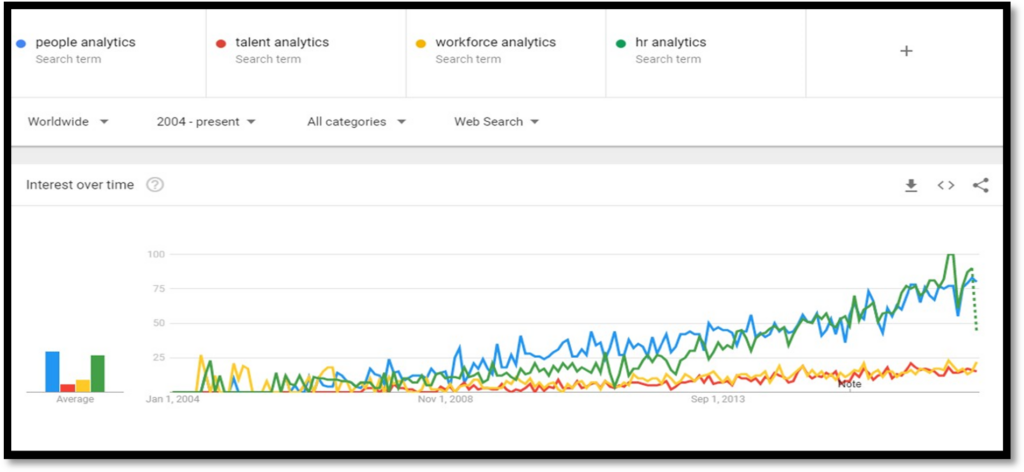
The below graph provided by Google Trends shows search interest for these terms since 2004. Both the terms HR analytics and People analytics have developed and become prevalent over the years and continue to gain interest. HR Analytics deals with analyzing the data related to the HR department.
Workforce Analytics is related to other departments like Customer relationships, Research and Development, Sales, Advertising, and Branding. HR analytics empowers HR professionals by utilizing data-driven metrics and acumen to upgrade the sourcing of the best candidates for different profiles within the organization and retain them. It facilitates leaders to make decisions to create better work environments and maximize employee productivity. It has a major impact on the bottom line when used effectively.
Source: microstrategy.com/us/resources;
*Google Trends data starts from 2004. Google Trends Description: Numbers represent search interest relative to the highest point on the chart for the given region and time.
HR professionals gather data points across the organization from sources like:
- Employee surveys
- Telemetric Data
- Attendance records
- Multi-rater reviews
- Salary and promotion history
- Employee work history
- Demographic data
- Personality/temperament data
- Recruitment process
- Employee databases
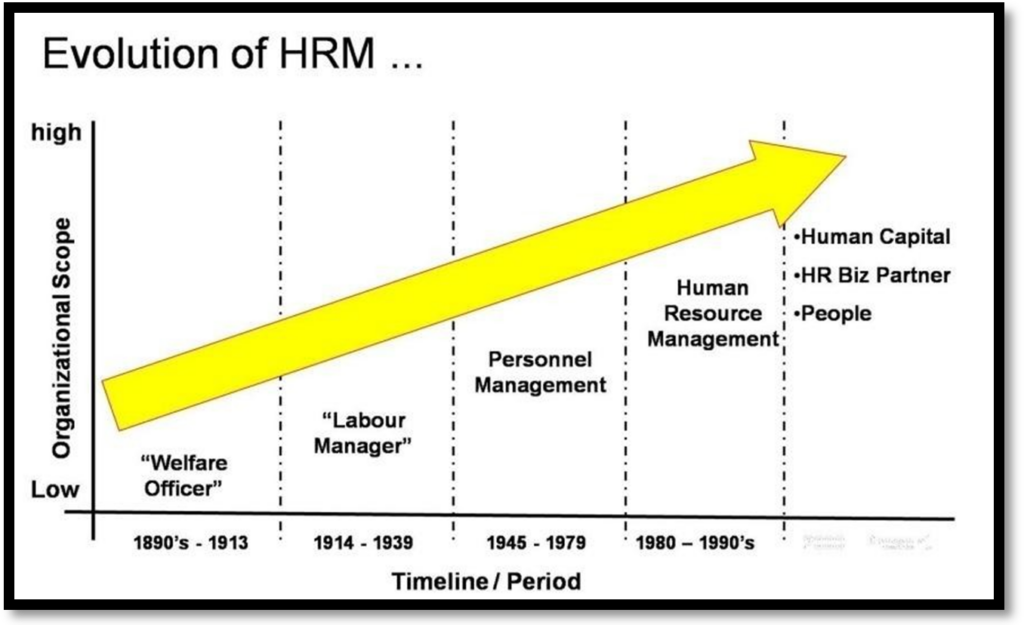
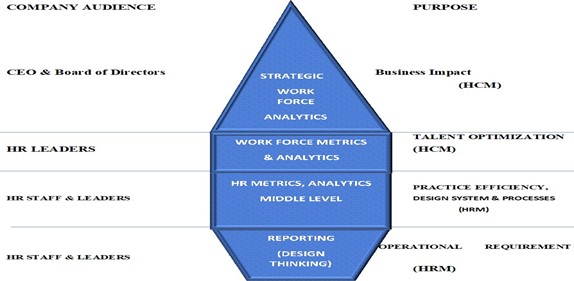
II. Evolution
- Value – Impact / Business Contribution V/S Time Period
- Welfare Officer: 2nd Industrial RevolutionLabour Manager: Bridge between Management and Labour: World WarsPersonnel Management: Admin jobs, Recruitment, Legal CompliancesHRM: Support function, Proactive, Employee engagement: Globalization
- Strategic HRM: Takes responsibility for the entire HR function. They work with the management very closely to improve the business process. Business HR is responsible to make the decision of strategy of management.
The HR department is evolving and has transformed itself from a traditional support function to a more strategic and data-driven one. HR Analytics is the use of statistics, modeling, and analysis of employee-related factors to improve business outcomes and emancipate HRA professionals to make data-driven decisions to get the right talent and retain the successful workforce. The various benefits of HR Analytics may include boosting ROI, employee retention, and enhance business processes.
The Future of Hiring: In the era of Analytics post covid-19 the hiring of the best talent increases and the organization should become more acrobatic in order to maintain its pool of talent. They need to focus on workforce planning and need to determine their hiring needs as per their budgets to have success in the near future.
Importance Of HR Analytics
Traditionally the main role of recruiters was to fill up the vacancies as per the requirements. Organization these days understands the importance of the workforce as a result there is a shift in focus towards acquiring the best talent available in the market.
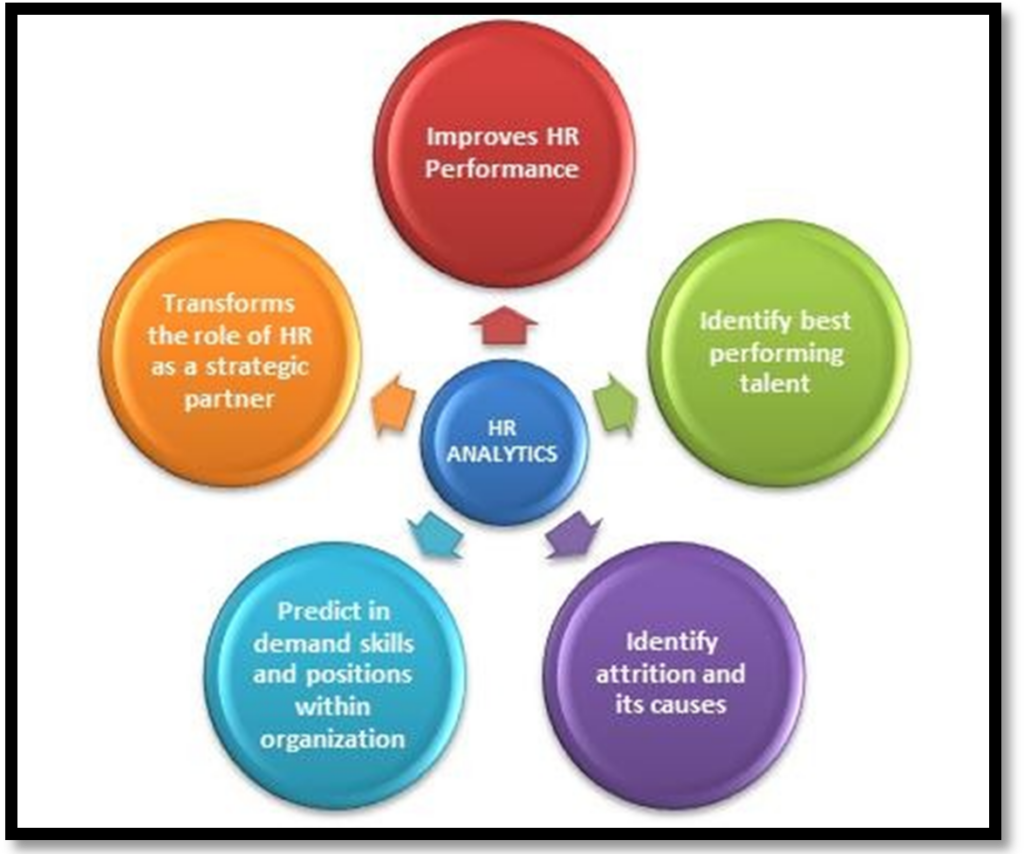
As job seekers are always in search of better opportunities, the talent acquisition team job should look into not only filling up the vacant positions, finding the right fit for the organization, and retaining them. There are various HR tools and technologies that have given recruiters data-driven recruitment through HR Analytics. Ex: Applicant tracking system and Recruitment Management System.
Data Collection:
1. Collecting the right data
The candidate’s database for various job openings can be segregated in terms of tears of experience, age, and qualification. These data can be amalgamated as per the profile requirements. The recruiters can add value to candidates’ profiles from their social media accounts like LinkedIn.
2. Data cleansing
After the data is collected the next step is cleansing the data as per the job profile. The resumes of a candidate are sorted as per the job analysis of the particular position in order to remove any misfits.
3. Re-Engagement
Moreover, after a job posting is closed, potential candidates might be overlooked. However, with the help of analytics, organizations can effectively re-engage these candidates based on upcoming vacancies, thereby improving talent retention and reducing the time-to-hire.
4. Attrition Analytics
In addition, analytics can help identify employees who may be considering a job change. By analyzing factors such as age, income, satisfaction levels, and tenure, organizations can proactively implement retention strategies. Thus, it serves as a powerful preventive tool against unwanted attrition.
5. Workforce Forecasting
Furthermore, predictive analytics allows organizations to anticipate future job market trends based on economic conditions. According to a joint survey by MIT and IBM, businesses with a strong analytics foundation experienced 8% higher sales growth, 24% higher operating income, and an impressive 58% increase in sales per employee. Therefore, leveraging workforce forecasting can significantly boost organizational performance.
Analytics allows for enhanced processes that improve human aptitude and efficiency.
Source: empxtrack.com
Major Tools of HR Analytics
- SAP
- EXCEL (Using pivot tables, graphs)
- POWER BI: Visualized Dashboard PYTHON
- R TOOLS
- TABLEAU: Business Analytics
- SPSS
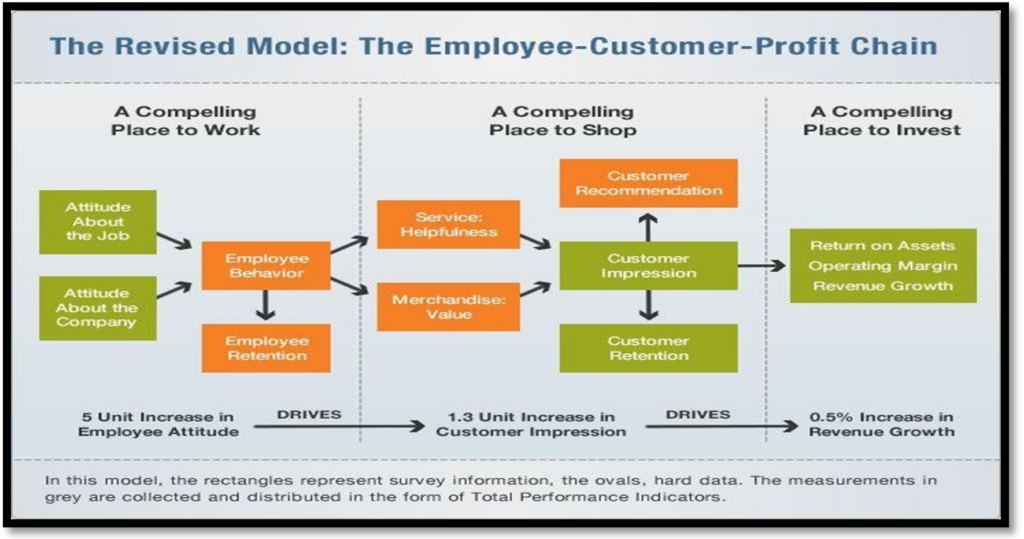
The main idea behind the Employee-Customer Profit Chain theory is that higher employee satisfaction ultimately leads to happier customers, which in turn results in increased sales and profitability. Therefore, managers should focus on investing in employee training and adopting new technologies. Moreover, these investments should be directly linked to the performance levels of all employees. Additionally, companies that prioritize both their employees and customers as individuals—rather than merely as tools for profit—are better positioned to successfully implement the Employee-Customer Profit Chain theory.
Classifying The HR Data:
![]() 1. Descriptive Analytics:
1. Descriptive Analytics:
Descriptive Analytics, as the name suggests, focuses on what has already happened in the past. To begin with, it identifies problems by thoroughly studying historical data. For instance, in the sales department of an organization, a report might illustrate the percentage of sales employees who have left the organization over the past year. Furthermore, this data can be segregated into various business units or product lines, allowing decision-makers to gain deeper insights into specific areas of concern.
![]() 2. Diagnostic Analytics:
2. Diagnostic Analytics:
Diagnostic Analytics represents the causes/ reasons revealed by the happening revealed by descriptive analytics. We can rank the reasons why Sales department employees departed. It may be due to the higher base salary offered by competitors.
![]() 3. Predictive Analytics:
3. Predictive Analytics:
Predictive Analytics tell us what will happen in the future. It predicts future events based on past events. If the forecast is sales employees are going to resign in the next 90 days, then we can advise the managers to approach and talk to them before it’s too late.
![]() 4. Prescriptive Analytics:
4. Prescriptive Analytics:
Prescriptive Analytics suggests what we should do next. Here decisions are taken based on the predictions. There is the formulation of new strategies to streamline the system or the business processes. The decision that is taken is completely based on data and is more reliable. If we have sales representatives resigning then prescriptive analytics may suggest a training program to be administered to them before their productivity is likely to decline. HRM will have to migrate from fundamentals of people science (resources) to Strategic HR (Decisions taken based on data/ information)
III. Workforce Analytics
Workforce analytics is the approach of measuring the behaviors of people (candidates, employees) and analyzing them to improve people and business performance. This is done by analyzing people’s data using statistical methods and software in order to make better workforce decisions.
HR Analytics deals with analyzing the data related to the HR department. Workforce Analytics is related to other departments like Customer relationships, Research and Development, Sales, Advertising, and Branding.
Source: analyticsinhr.com/blog
IV. Analysing The Recruitment Metrics
What Is Recruitment Analytics?
Recruitment analytics is a process of using data-driven metrics and insights to improve the sourcing of the best candidates for different roles within the organization that will help cut costs and better understand factors that are influencing the hiring process.
Recruiting metrics are measurements used to track hiring success and optimize the process of hiring candidates for an organization. When used correctly, these metrics help to evaluate the recruiting process and whether the company is hiring the right people.
Recruitment Analytics will help to understand different mechanisms so that the company can create an effective recruitment process.
Source: analyticsinhr.com/blog
Major Recruitment Metrics: (Identify the health of the recruitment system)
Recruitment Tracker
Source: analyticsinhr.com
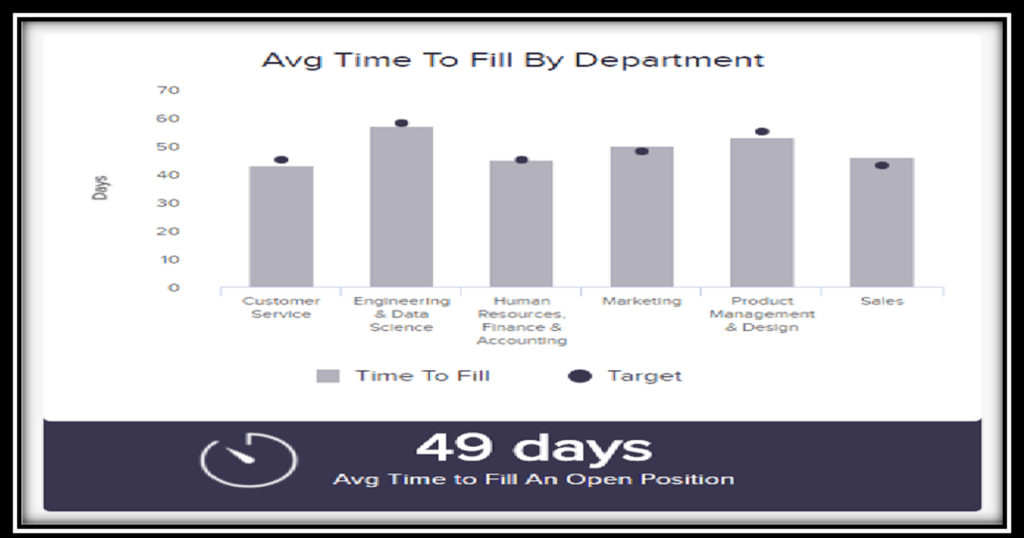
1. Time to Fill:
Time to fill refers to the time taken to hire new candidates and is measured by the number of days between a job posting and hiring a candidate.
- Start Date – Date of Interview
- Start Date – Date of Joining
- 1st interview – Date of Joining
Factors of Evaluation:
- Number: 45 days; Number of days between job posting and hiring a candidate.
- Unit: Days
- Turnaround Time (TAT): Avg. turnaround time: 49 days across the department
- Relation wrt Company’s profit(Y/N): Lesser the time more the profit: Y
- Measurable (Y/N): Y
2. Quality of hire:
It indicates the individual who is hired is beneficial for the organization. It measures the performance of the individual during a 6 month / 1-year time period. Low ratings indicate a bad hire and this cost the company a considerable amount of money.
Quality of Hire = (Number of hired candidates considered satisfactory / Total Number of candidates hired) *100
Factors of Evaluation:
- Number: ½ year, 1 year;
- Unit: Year/ Month
- Turn Around Time (TAT): Avg. turnaround time: 6 months / 1 year
- Relation wrt Company’s profit(Y/N): Lesser the time more the profit: Y (For Good appraisals)
- Measurable (Y/N): Y
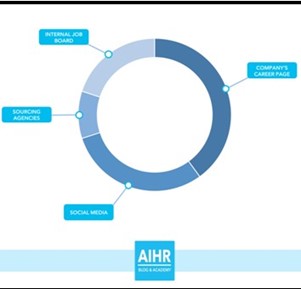
3. Source of hire
We should track the source that attracts new hires to the organization. This metric also traces the most productive source from different recruiting channels. We should focus on sources giving good numbers of hires; Expenditure should be done on that which would save some money.
Factors of Evaluation:
- Number: Amount (Rs) (Money spent for each source: internal/external)
- Unit: Rs
- Turn Around Time (TAT): Avg. turnaround time: 1 day to a few months till the job opening is valid
- Relation wrt Company’s profit(Y/N): Y
- Measurable (Y/N): Y
Employee Referral rate: (Number of rereferrals /. Number of Open Jobs) *100
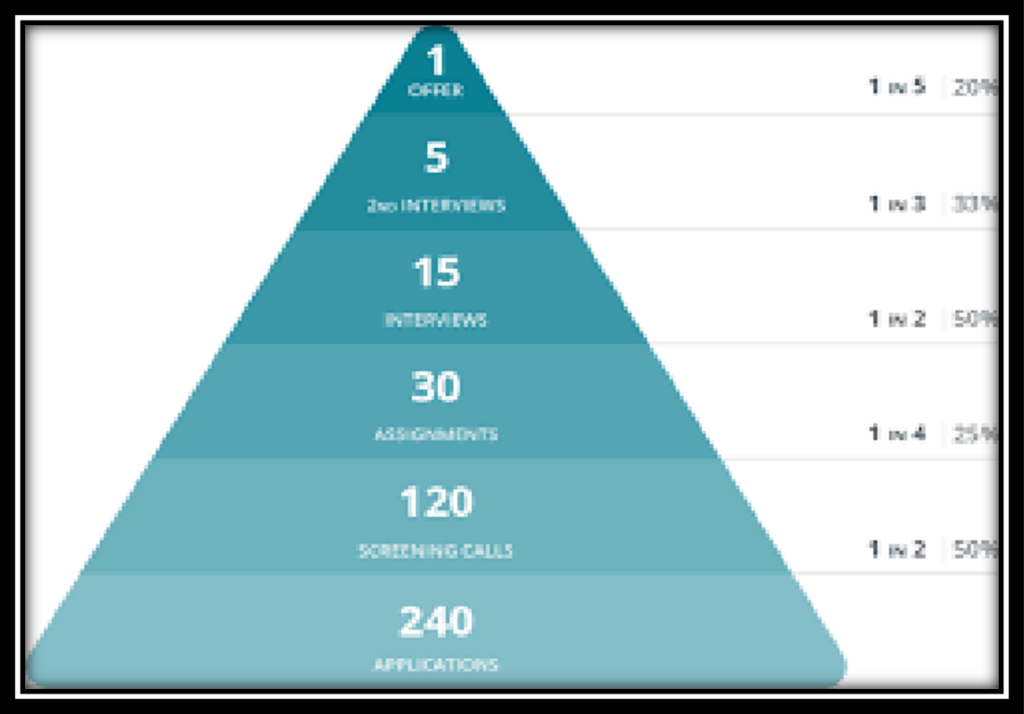
4. Recruitment funnel effectiveness: Yield Ratio
It is a funnel that starts from sourcing candidates and ends with a signed contract. If we measure the effectiveness at each stage of the recruitment funnel, we can get the yield ratio step-wise.

Factors of Evaluation:
- Number: candidate (nos.)
- Unit: Number
- Turn Around Time (TAT): No. of days to get the job opening closed. : 240:1
- Relation wrt Company’s profit(Y/N) : Y
- Measurable (Y/N): Y
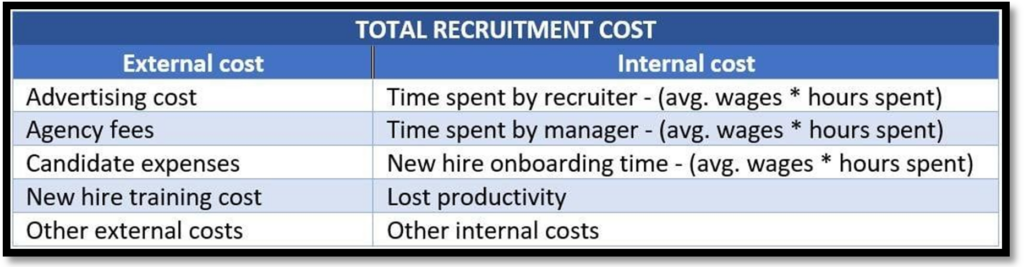
5. Cost per hire: Sourcing Channel Cost:
It deals with the costs incurred while hiring an employee. It gives a fair idea as to where we can cut costs during hiring activity without overlooking the candidate’s quality and experience level.

- Before a financial year budget on recruitment is given by the management to the HR Department. Then HR pred year and prescribes.
- Focus on the low-cost source
Factors of Evaluation:
- Number: Amount
- Unit: Rs
- Turn Around Time (TAT): No. of days to get the job opening closed.
- Relation wrt Company’s profit(Y/N): Y (When it takes time)
- Measurable (Y/N): Y
6. Applicants per opening:
It refers to the number of job applicants per job opening. If we have large job applicants then it shows high demand for jobs but at the same time, it may also indicate that the job description is too wide.
Applicants per opening: (Number of Job Applications / Number of Job Openings)
We need to reduce the Job applications by having specific Job descriptions.
Factors of Evaluation:
- Number: candidate (nos.)
- Unit: Number
- Turn Around Time (TAT): No. of days to get the applications for the job posting within the days prescribed in the advertisement :
- Relation wrt Company’s profit(Y/N) : Y
- Measurable (Y/N): Y
7. Offer acceptance rate:
The offer acceptance rate compares the number of candidates who successfully accepted a job offer with the number of candidates who received an offer.

Factors of Evaluation:
- Number: candidate (nos.)
- Unit: Number
- Turn Around Time (TAT): 1 day: No. of days candidates take to give acceptance offer after being
- offered.Relation wrt Company’s profit(Y/N) : Y
- Measurable (Y/N): Y
V. Analysing The Attrition Metrics
Attrition in human resources refers to the gradual loss of employees over a period of time. (New hires cannot adjust to organization culture). High attrition is troublesome for companies. HR professionals take a leadership role in formulating company compensation programs, work culture, and motivation systems that help the organization retain top employees.
Major Attrition Metrics:
Source: analyticsinhr.com
1. Employee Retention:
It refers to strategies used to revamp the workplace so that the employees are satisfied, and qualified to excel in their current job.
(Total number of employees – number of employees who have departed)/ Total number of employees
2. Gallup Survey Score / Employee Survey Score:
Source: https://q12.gallup.com/public/en-us/Features
The Gallup Q12 score represents the average of the scores of 12 items that Gallup has consistently found to measure employee engagement as linked to business outcomes.
Measurement That Means Something:
- Employees answer 12 simple questions, available in over 30 languages including Arabic, Chinese, Spanish, French, German, and more that tie directly to performance outcomes.
- Scores are on a 1 to 5 scale, which clearly highlights strengths and opportunities.
- Scoring: 1 to 5 point scale statements; 1: Strongly Disagree to 5: Strongly agree. A score between 1 to 3: Not attached to the company.
- When improvement efforts focus on the essential elements of engagement, those measured by the Q12 survey, team performance Gallup Q12 Questions Case:
- Do you know what is expected of you at work?
- Do you have the materials and equipment to do your work right?
- At work, do you have the opportunity to do what you do best every day?
- In the last seven days, have you received recognition or praise for doing good work? Scale: 4 /5 = 4/5*100 = 80%
- Does your supervisor, or someone at work, seem to care about you as a person?
- Is there someone at work who encourages your development?
- At work, do your opinions seem to count?
- Does the mission/purpose of your company make you feel your job is important?
- Are your associates (fellow employees) committed to doing quality work?
- Do you have a best friend at work?
- In the last six months, has someone at work talked to you about your progress?
- In the last year, have you had opportunities to learn and grow?
3.NET Promoter Score: NPS:
Source: netpromoter.com
Net Promoter Score (NPS) is a management tool that can be used to gauge the loyalty of a firm’s customer relationships. It serves as an alternative to traditional customer satisfaction research and is claimed to be correlated with revenue growth. NPS has been widely adopted with more than two-thirds of Fortune 1000 companies using the metric
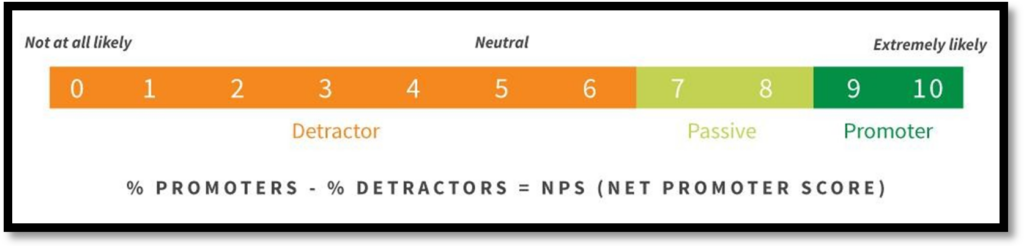
Respondents are grouped as follows:
- Promoters (score 9-10) are loyal enthusiasts who will keep buying and referring others, fuelling growth.
- Passives (score 7-8) are satisfied but unenthusiastic customers who are vulnerable to competitive offerings. (Neither support nor against)
- Detractors (score 0-6) are unhappy customers who can damage your brand and impede growth through negative word-of-mouth.
- The more the NPS the more customers like the company/ product
- NPS should be around 75% standardized
4. Absenteeism Rate:
Highly motivated and engaged employees take in general fewer sick days (up to 37% less, according to Gallup). Additionally, absent employees are less productive, and high absence rates throughout an organization are a key indicator of lower organizational performance.
Absenteeism: [(Avg no. of employees * Missed working days) / Avg. No. of Emp* Total working days]*100
VI. Conclusion
In today’s scenario, the pandemic COVID 19 which came out of the blue has a devastating effect not only on recruitment but also on the economy of the world. Though this may be for a short period the impact would continue for several years to come.
90 % of companies like TCS, Accenture, and Cap Gemini are doing work from home. Companies in sectors like Hospitality, Tourism, and FMCG have taken a hit place are likely to witness this delay in virtual mode of operation. Sectors like Banking/ Logistics/ Exports will go for the virtual work front. Digital Platform companies will as far as campus placement reduction on hiring. It is a worrisome factor as l marketing, digital payments, e-commerce, and e-learning companies will grow Offers made last year, of them will be put on hold for around 12 months to recover.
Source: ET NOW Webinar on 18 Lease; 2. Hitesh Oberoi: CEO Naukri.com; 3. Tarandeep Singh: CEO Cocubes; 4. Dalmia: Managing Editor ET Now; Source: Daash et al.,2020, J Natural Remedies.
Major Challenges of HR Analytics in the Future
Holding Information
HRIS, LMS (Learning Management System), and ATS (Applicant Tracking System) deal with relevant and often current information and deliver high-impact reports to stakeholders
Broad Data
Pinpointing on metrics too large to assess. E.g. Voluntary vs. Involuntary Termination statistics. What if the right people are voluntarily leaving and the wrong employees are retained?
Analysis Skills
HR professionals should enhance their analysis skills for professional development Big Data and NOT So Big: Too much data or less data becomes a problem to make big decisions.
References
- https://www.microstrategy.com/us/resources
- https://hrdictionaryblog.com/
- https://www.analyticsinhr.com/blog
- https://empxtrack.com/blog/predictive-hr-analytics/
- https://www.datasynctech.com/data-analytics-vs-reporting
- https://q12.gallup.com/public/en-us/Features