Annjaan Daash
Research Scholar, Annamalai University, Tamil Nadu, Training and Placement Head, Regional College of Management, Bhubaneswar, Odisha.
Dr. Prabir Pal
Prof., Chairman, Regional College of Management, Bhubaneswar, Odisha.
Dr. S. Pragadeeswaran
Professor, Department of Business Administration, Annamalai University, Annamalai Nagar, T.N., India.
Abstract
In the recent era, serious challenges arise in maintaining customer satisfaction, competing in the market, winning the trust of customers, and creating a brand name for sustaining business. Besides, maintaining the quality of the product, competitive price, and growth of the firm in terms of business and profits, in the long run, are other challenges.
So, proper human resource management at all departments including marketing plays a vital role in these. In this context, there is a need to examine customer-focused leadership and competency mapping for the same. Besides, the study outlines the core competencies and sub-competencies for leadership management.
A viable competency management system mainly facilitates an ecosystem for continuous performance, improving the consistency of standards and providing scope for improving skill and abilities, and tracking the outcomes and developments within an organization. Competency mapping requires to be evolving in order to build necessary capabilities and address emerging challenges.
Keywords– Leadership Brand, Competencies, Competency Mapping, Leadership Development
1. Introduction
The focus of this study is to critically evaluate leadership competencies based on an extensive review of the literature and primary data taken from selected firms in the pharmaceutical sector that deals with customers. Being customer-focused puts one in a better position to help customers, in a forthright way.
The customers will visualize that the company is going overboard to understand the situation in which they are and to be better able to help them get where they want to be. Customer-focused leadership is precisely as it sounds: companies that utilize the fact that is based on putting the customer first in everything that they do. It is a team approach that revolves around the complete customer experience that leads to overall customer satisfaction, customer loyalty, and repeat business.
Besides, the study outlines the core competencies and sub-competencies for leadership management. A viable competency management system mainly facilitates an ecosystem for continuous performance, improving the consistency of standards and providing scope for improving skill and abilities, and tracking the outcomes and developments within an organization. Competency mapping requires to be evolving in order to build necessary capabilities and address emerging challenges.
One should invest in an organisation taking into consideration factors like understanding the business and leadership team. This visibly demonstrates the importance of Leadership Development for an organization’s competitive advantage. Most organizations conversely invest huge amounts for the leadership development program but achieve no results. There are reduced performances in both experienced and promising newcomers.
Tottering programs and haphazard solutions are not fruitful. As a modification, a competency-based leadership development process where critical behavioral descriptors connect what the organization stands for and clearly portray staged expectations based on the maturity of an employee and give a structured model for preparing a development directory for each behavioral descriptor.
Hence this study was undertaken to compare an Indian National pharmaceutical company with 2 MNCs and suitable competencies were recommended to an Indian national company. This comparison was made to find out the differences between 2 successful already adopted competencies MNC organizations with an Indian national company that is yet to implement it.
It is also important to analyze various aspects, descriptors, and strategies to enhance the competency of employees, particularly in marketing departments to focus on customer-based leadership. The present study has made attempts in this direction both in providing the theoretical perspective and empirical verification of competency mapping by analyzing data.
Leadership Development
These days all leading organizations have either explicitly crafted and deployed or implicitly perceived and randomly perpetuated leadership development programs. The organizations that have explicitly crafted the competencies and consciously linked them to the leadership development initiatives have been more successful than those who did otherwise.
In the arena of leadership competencies and leadership development, two questions stifle any HR professional throughout the world.
“A. In spite of utilizing so much energy and time in developing the leadership competencies, how come survivors pass all the competency tests either during entry level recruitment or post entry level assessment centre, but somehow, they do not inspire much confidence in their ability to respond to future challenges?”
“B. Despite having a pool of great leaders why the organization fails to develop a leadership pipeline?”
Source: Dave Ulrich et.al, 2007
In this context Dave Ulrich in his recent release “The Leadership Brand,2007” argues that “Leadership field has become so enamored with competencies and personal characteristics of leaders that the leader’s job to deliver results is almost forgotten.”
Difference Between Leader and Leadership
Most of the recent approaches focus on building individuals as leaders rather than building leadership as an organization capability for the organization.
We need to shift from studying leadership to leadership. It is easy to be enamored of a great leader who has charisma, personality, emotional intelligence and charm and who delivers great results. Celebrity leaders have become de rigueur on the covers of business magazines and most of us like to identify and admire them. But do these leaders represent leadership? To more fully understand the relationship between leader and leadership, let me quote two powerful analogies.
Source: Dave Ulrich et.al, 2007
Analogy 1: Mother Vs Motherhood
An individual mother is a powerful figure as a member of a family. However, the concept of motherhood is focused on nurturing the next generation of children so that they can grow up to be contributing members of society and make their families proud.
Analogy 2: Shepherd Vs the leading sheep in a group
A Leader is like a shepherd, He stays behind the flock, letting the nimblest go out ahead, whereupon the others follow, not realizing that all along they are being directed from behind.
Hence leaders matter but leadership matters more. Leadership matters because it is tied not to a person but to the process of building leadership. Good leaders do not just build personal credibility they build the organization’s leadership capability, or the capacity of the organization to sustain future leaders. Great individual leaders may come and go but great leadership endures over time. Source: Dave Ulrich et.al, 2007
Hence being a leader focuses on the person; building leadership focuses on the organization that creates leaders.
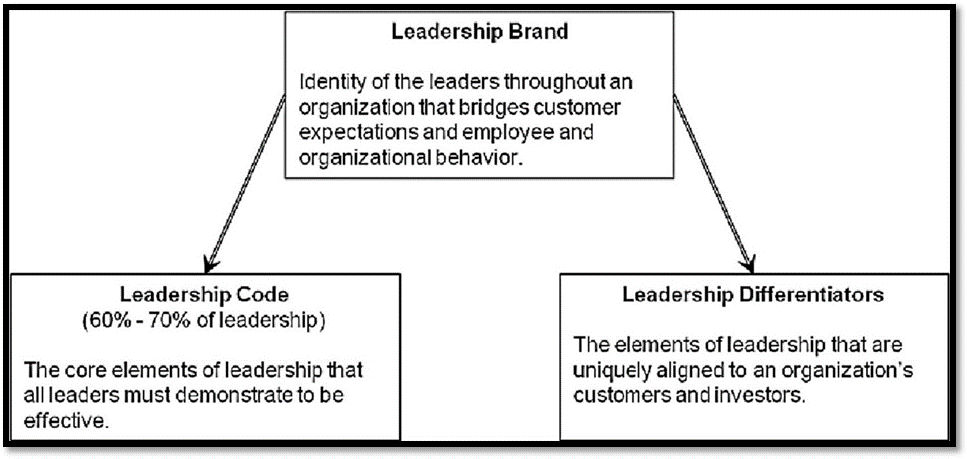
Leadership Brand
Source: (Dave Ulrich et all 2007, Leadership Brand)
The next factor of HR innovators and integrators is the leadership brand. A leadership brand has both invisible fundamentals and visible differentiators of its own. It is the identity of the leaders throughout an organization that bridges customer expectations and employee and organizational behavior, Ulrich et al, 2007. Traditional leadership is from inside out and leadership brand is from outside in. Leaders must get the invisible basics correct and efficiently organize and deliver the fundamentals that keep their products and services at levels that meet and exceed customer expectations.
Leadership that Lasts Beyond Lifetime
The most successful leaders know more than to pretend to be someone they are not. Whenever they get the opportunity, they reinvest in his strengths. They surround themselves with companions who complement one another’s qualities. The ultimate litmus test for leadership is not what they can achieve today, but what continues to flourish long once they are gone.
In the 1960 HBR article Marketing Myopia, Theodore Levitt said, “In modern days businesses are customer produced and customer-pleasing creatures, and success in the market world means offering consumers enough reasons to pick.” With this in mind, it is critical to examine capabilities for customer-focused leadership.
In a knowledge-based prosperous economy, every firm must review its workforce’s competence and take action to improve it on a regular basis. Competent people are valuable resources that propel the company ahead, resulting in success. A “competence” in tradition, according to McClelland (1973), is “a personal quality or set of practices that leads to the more effective or better work performance.” In layman’s words, it contributes to the increase of a person’s talent and the economic worth of his efforts on the work.
Competency is the capacity of a person to generate behavior that is appropriate for the work needs and is regulated by the parameters of an organizational structure, resulting in the
accomplishment of objectives. Competence is made up of Knowledge, Skills, Abilities, and Values, and it directs the efficient delivery of organizational responsibilities.
Competency mapping is used to define important traits such as knowledge, skills, or behavior that are required for accurate job categorization. The organization examines the strengths and weaknesses of individuals that identify areas that need to be focused on for career growth via competence mapping.
Assessment of leadership strengths and weaknesses, as well as appropriate strategies to develop leadership abilities, are critical for organizational effectiveness and sustainability. It is important to identify the skills of any organization. The health industry, as a service provider or a crucial sector for the economy, may serve as an excellent case study. The major goal of the thesis in this context is to critically assess the mapping of core skills & sub-abilities of customer-focused leadership.
2. Literature Review
- Lee, Park, and Lee (2015) conducted a survey by collecting data from both business and technology experts in 126 project groups. They have concluded that knowledge and communication seem to play important roles in making team social capital between business and technology experts in collaborating projects.
- Shet et.al (2017) have provided a comprehensive review of the literature on various dimensions of leadership competencies and identified the scope for future research. They have suggested for assessing the validity and reliability of competency measures suggested in different models is an important gap. These are sparse use of dependent variables. They have emphasized on critical roles of organization and human resource practices for developing competency. A particular MNC implements its competency model across the nations it operates. Every organization has its own competency model. They have suggested making Comparative analyses in specific industries or in different levels of management which are influenced by leadership competency management. Besides it is important to identify specific competency that influences the role of holders, individuals, or organizations in future studies.
- Qiao and Wang (2009) have analyzed the competencies of mid-level managers in China and observed that communication is crucial among others like lifelong learning and coordination and team building. Lara et. al, (2020) have observed the need of distinguishing personal, external, and interpersonal competencies which vary according to cultural differences.
- Tyrańska (2016) has made an extensive review of literature and provided overview of observations on important competencies that manager requires at different levels of Management such as higher, middle and lower. He conducted study on 100 experts which include 50 employees among others. He observed that while the top level of management needs business competencies, middle level depends on leadership competencies and lower-level managers mostly rely on specialized competencies.
- In this context the present study tries to work on these gaps, and in assessing whether there is variation between perspectives on competency between MNC and Indian companies. Besides, we have employed competency perspective score as dependent variable to understand its associated predicting factors.
- (Tourani & Rast, 2012). The key to business success is effective communication among all lines of the company. Reliable communication must provide, from the highest level to the lowest level workers, information about what the current industry challenges is, what is happening in the work environment, and the company’s strategic objectives
- (Reilly, 2008; Sudhir, 2018). The professional function of human resources helps overcome crises experienced by a company. Communication during a crisis is used to provide a systematic framework for dealing with crises that occur. HR professionals as communication hubs support line managers answering essential questions from employees
- (Elshaer, 2013). Being responsive as a predictor of employee satisfaction reflects more in the sensitivity to communicate with others by recognizing the desires and needs of others.
- Takey and Carvalho (2015) have suggested a seven-step method for competency mapping of managers on the basis of data collected from an engineering company in Brazil. They have involved 83 professionals for observations and employed mixed methods for analysis. They have observed that assessing competence levels that differentiate professional groups, and association between experience and competency level are important besides understanding the present competency level of employees.
Reason for selection of Pharmaceutical Industry
India ranks 3rd worldwide for pharmaceutical production by volume and 14th by value. The country has an established domestic pharmaceutical industry, with a strong network of 3,000 drug companies and ~10,500 manufacturing units. The global pharmaceutical market for the year 2010 was US $875 billion (audited and unaudited) with the growth of 4.1% over the previous year. In 2003, a maximum growth of 9.1% over the previous year was recorded. Globalization of Indian Pharmaceutical Industry started in the early 1990s when the government opened its markets to foreign investments. Indian Pharmaceutical Industry’s Globalization took place with the coming of foreign companies in the sector.
India is the largest provider of generic drugs globally. Indian pharmaceutical sector supplies over 50% of global demand for various vaccines, 40% of generic demand in the US and 25% of all medicine in the UK. Globally, India ranks 3rd in terms of pharmaceutical production by volume and 14th by value. The domestic pharmaceutical industry includes a network of 3,000 drug companies and ~10,500 manufacturing units.
India enjoys an important position in the global pharmaceuticals sector. The country also has a large pool of scientists and engineers with a potential to steer the industry ahead to greater heights. Presently, over 80% of the antiretroviral drugs used globally to combat AIDS (Acquired Immune Deficiency Syndrome) are supplied by Indian pharmaceutical firms.
Currently the Indian Pharmaceutical industry is a vibrant, high technology-based and high growth-oriented industry, attracting attention the world over for its immense potential to produce high quality drugs and pharmaceutical formulations. The pharmaceutical industry is among the most highly R&D intensive industry.
Various industry reports suggest that the industry has been growing at 13 to 14 percent over the last 5 years a sharp rise from the 9 percent compounded annual growth rate between 2000 and 2005. Most of the growth drivers have kept pace with expectations (Fig 3). India’s GDP from 2005 to 2009 grew at about 8 percent. Growth in medical infrastructure and health insurance coverage has been in line with expectations. The treatment of chronic diseases has gone up. The remarkable success of a few recent launches has demonstrated the true potential of patented products. (Source: McKinsey & Company, India Pharma (2020), Consolidated FDI Policy, July 2021)
Manifold rise in public healthcare spending, rising patient awareness, expanding insurance coverage across the income pyramid and the emergence of new hospital formats illustrates this flux. Second, in the past 3 to 4 years, industry structure in pharmaceuticals has changed with remarkable shifts in the leader board. Four of the top ten players, including the market leader, are new entrants. Finally, traditional sources of growth are making room for newer ones.
3. Research Problem
A research problem, in general, refers to some adversity which a researcher experiences in the context of either a theoretical or practical situation and wants to obtain a solution for the same (Kothari,2004). Hence research problem is an expression or a statement of area of concern. Competency Analysis of Customer focused leadership and competency mapping have drawn attention of top management, managers, HR managers and researchers.
It is true that several factors are related to the organization being successful but in the present study the researcher has made efforts to compare competency mapping of customer focused leadership of MNCs like Vestergaard Frandsen and Sumitomo Chemicals who have already implemented with Indian National Company like Ajay Biotech who is yet to implement the same and suggest selected competencies with their behavioural descriptors to them.
Need and Objectives of the Study:
It is said that think global and act local. While local patterns change more rapidly than common global patterns hence the key competency for any organization may have its significance for a considerable period but for local customization the behavioural descriptors need to be revisited at regular interval.
Customer-focused leadership takes into account the companies that are operated by putting the customer first in everything that they do. It is a team outlook which is centred around complete customer experience leading to overall customer satisfaction, customer loyalty and repeat business. Customer focus means placing your customers’ needs topmost. Customer- focused businesses encourage a company culture dedicated to enhancing customer satisfaction and building strong customer relationships.
The study’s main goal is to uncover customer focused leadership competencies, competency mapping or its influence on organizational performance. The research focuses on the assessment of leadership qualities based on a thorough analysis of the literature and a focused group discussion with chosen pharmaceutical companies that engage with consumers.
Focusing on the consumer means that a greater position to serve them in a genuine way. Competency mapping is accomplished by determining the gap between the needed level of skills and the present level of competencies by comparing MNCs that have previously adopted competency mapping to Indian National Companies that have yet to apply. These competencies have really been picked as a result of doing such a survey.
In this study we have made an attempt to compare between 2 MNCs who have adopted competency skill mapping with an Indian National Company who have not yet implemented the same.
Objectives of the Study:
- To find out the behavioural descriptors of the selected competencies of customer focused leadership in pharmaceutical companies.
- To analyse the impact of selected competencies on leadership in pharmaceutical companies.
- To evaluate the selected competencies on different level of management
- To compare the competency level between Indian company and MNC pharmaceutical companies.
Research Framework
The title of the study is “Competency Analysis of Customer Focused Leadership”. The following course was adopted.
Step-1: The leadership portfolio explored by the legendary Kouzes and Posner in their treatise “The Leadership Challenge” was taken as the base. This treatise is established on years of research and practices employed in majority of Fortune 500 companies.
Step-2: Leading behaviours were collected from leading sources given in bibliography section and clustered them into the above-mentioned leadership portfolio
Step-3: Prepared a questionnaire asking a group of experienced executives to choose leading behaviours from each portfolio that matters for their organization.
Step-4: Made focused group interview to prepare a maturity banding of the leading behaviors
Step-5: Discussed with leading executives to prepare a sample development plan for one behavioral descriptor
- Competency score is calculated by taking descriptive competency indicators. Mainly we have tried to find out score for energetic leader on the basis of employee’s perception of various descriptions of this component in five-point rating scale. As some of the components do not have much variation s across observations, simple average score is used instead the score by Principal component analysis.
- Multiple linear regression model will be employed to identify the important determinants of competency mapping score on a cross-sectional frame work.
- The following model will be used to examine the predictors of competency mapping score.
- Energetic leader Competency Score Y = a+b1Income + b2 Edn+b3 D_Nature of company+b4 Mid-level management dummy+b5 Top level management dummy+ b6 Communication level+e
- Y : Dependent Variable, Avg. score of Competency, Multiple Linear Regression Model
- Independent Variable: Education, Income, Communication, level of management….
- Ordinary Least square (OLS) technique will be employed to find regression co-efficient of determinants.
- Diagnostic tests will be applied to check regression problems.
Variables Defined Contd.
VARIABLES
Independent Variables Dependent Variables Variables
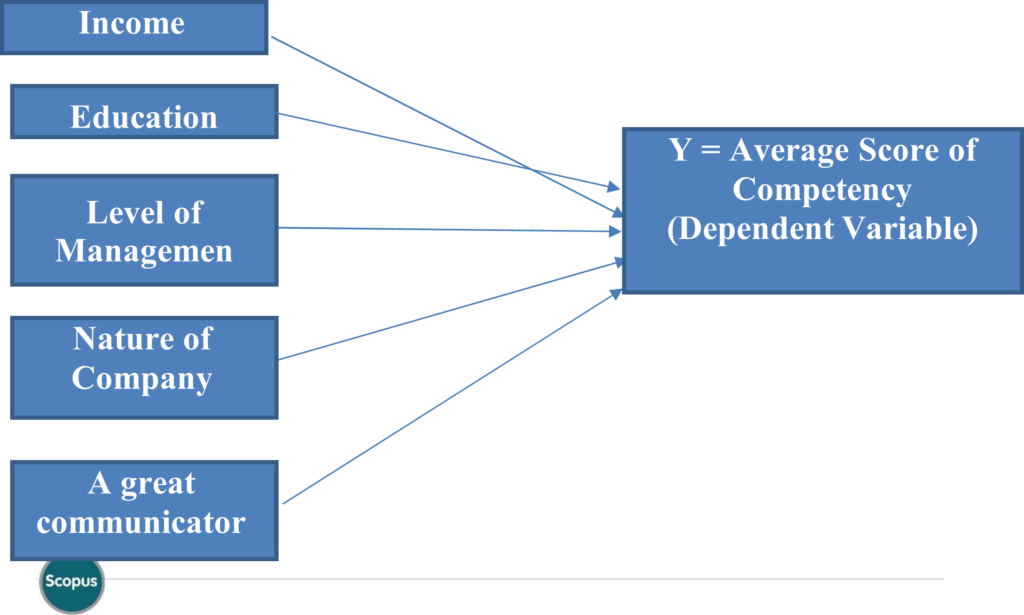
In the present study, energetic leader Competency Score “Y” will be treated as dependent variable and Education, Income, Communication, level of management, Nature of Company and 10 suggested Competencies will be treated as independent variable. The study is aimed to find out the relationship between dependent variable (competency score) and independent variable as mentioned earlier).
Competency score (Dependent Variable) is calculated by taking descriptive competency indicators. This study aims to find out score for energetic leader on the basis of employee’s perception of various descriptions of this component in five-point rating scale. As some of the components do not have much variation s across observations, simple average score is used instead the score by Principal component analysis.
Multiple linear regression model will be employed to identify the important determinants of competency mapping score on a cross-sectional frame work.
The following model will be used to examine the predictors of competency mapping score. Energetic leader Competency Score.
Sampling Procedure
Sampling Adopted in the Study
The Study is based on primary data collected through scheduled questionnaire. Pilot survey is conducted to validate and finalise the survey tools/questionnaire. At 1st stage we have selected three companies purposively considering the brand and who agreed to provide data. As the data are related to their management and HR competencies, many companies did not prefer to provide data and respond to our mail. Three leading pharmaceutical companies such as Ajay Biotech, Vestergaard Frandsen, and Sumitomo Chemical have been surveyed for the study.
Complete enumeration or Census method for surveying respondents– As the total employees (executive level) in these companies are limited (156), we employed census method and served the questionnaire to all employees (executives) of these three companies operating at India. However, only 110 employees responded to our questionnaire which is 71% of total employees in these companies. These respondents cover all levels of management including Top Level, Middle Level and Lower Level. So, our sample for the study consists of 110 executives covering different departments and including all levels.
Table 14: Respondent classification
| Respondent Classification | Vestergaard (MNC) | Ajay Biotech | Sumitomo Chemical MNC | Total |
| Level 1(0-5 yrs of experience) | 6 | 37 | 4 | 47 |
| Level 2 (6 – 10 yrs of experience) | 5 | 15 | 13 | 33 |
| Level 3 (>= 10 yrs of experience) | 9 | 17 | 4 | 30 |
| Total | 20 | 69 | 21 | 110 |
| Vestergaard | No. of Employees | Ajay Biotech | No. of Employees | |
| Level 1(0-5 yrs of exerience) | 6 | 7 | 37 | 48 |
| Level 2 (6 – 10 yrs of experience) | 5 | 6 | 15 | 27 |
| Level 3 (>= 10 yrs of experience) | 9 | 12 | 17 | 25 |
| Total | 20 | 25 | 69 | 100 |
| Sumitomo Chemical | No. of Employees | Total Samples Collected | Total Employees |
| 4 | 7 | 47 | 62 |
| 13 | 18 | 33 | 51 |
| 4 | 6 | 30 | 43 |
| 21 | 31 | 110 | 156 |
| Table: Sample structure | |||
| Total employees (executives) | Nos of Units responded and included in analysis | Not Responded | |
| Vestergaard Frandsen | 25(100%) | 20(80%) | 5(20%) |
| Ajay Biotech | 100(100%) | 69(69%) | 31(31%) |
| Sumitomo Chemical | 31(100%) | 21(68%) | 10(32%) |
| Total | 156(100%) | 110(71%) | 46(29%) |
Source: Compiled by authors
Types of Research
Research design is a comprehensive plan of how the targeted objectives of the research will be achieved. Uma Sekaran (2006) has stated the research design as the planning of various phases and procedures related to the formulation of research design. It is an arrangement of the important conditions for acquiring and analyzing the data in a form that aims at mixing relevant information for the research purpose. Research design is a master plan to specify the methods and procedures for collecting and analyzing the required information.
A research design is the arrangement of conditions for collection and analysis of data in a way that aims to combine relevance with research purpose, being economical, flexible and efficient in procedure. Research design is the conceptual framework within which research would be conducted. The objective of research design is to provide for the collection of relevant information with minimal expenditure of effort, time and money. According to John W. Best (2002) Research is a systematic and objective analysis and recording of controlled observations that leads to development of organizations, principles and a possible control of events.
The research design used in the study is Descriptive as the study carried out describes various competencies possessed by employees at different level of management in pharmaceutical industry. Descriptive research attempts to describe systematically a situation, problem, phenomenon, service or programme, or provides information about, or describes attitudes towards an issue.
Moreover, the study also aims to describe the relationship between competencies implemented in MNC’s and is compared to an Indian National company. The main objective of this study is to find out the behavioural descriptors of the selected competencies of customer focused leadership.
- Stratified Random Sampling Technique – 120 employee respondents from three pharmaceutical companies such as Ajay Biotech, Vestergaard Frandsen, and Sumitomo Pharmaceuticals are randomly selected giving weightage to their total employees in India. Respondents cover all levels of management including Top Level, Middle Level and Lower Level.
- Sample Size – 110 taken: (30, 33, 47)
- Population – Pharmaceutical industry
- Departments Covered: Marketing, Sales, Production, R&D, HR/ Admin, Accounts.
The population of the Study
The competency score and competencies of customer focused leadership which will be identified through research undertaken might be applicable to pharmaceutical industries of Indian National company and MNC’s. To make the study feasible, executives of various departments namely, Marketing, Sales, Production, R&D, HR/ Admin, Accounts. of the 3 pharmaceutical companies of pharmaceutical industry in India and abroad will be included as the population.
Sample of the Study
Researchers usually draw conclusions taking large groups as sample A Sample is a segment of the population selected to represent the population as a whole. Ideally, the sample should be representative and allow the researcher to make accurate estimates of the thoughts and behaviours of the larger population. A sample as the name implies is smaller representation of a larger, where the observation of same phenomenon in competency score and customer
focused leadership competencies would involve such a mass of data. In present study, the researcher will choose a sample of 110 respondents of pharmaceutical industry situated in India region.
Sources of Data
There are two types of collection method.
- Primary Data: Primary data is collected by the researcher himself for the purpose of a specific inquiry or study. The data is original in character and highly representative and unbiased. There are various methods for primary data collection such as observation method, interview method, telephonic interview, questionnaires and schedules.
- Secondary Data: Secondary data is already collected by someone else which may be published or unpublished. This data is primary data for the agency that collects it and becomes secondary for someone else who uses this data for own purpose. Various methods for secondary data collection are publications of central, state and foreign government, internet, journals, case study, books, magazines, newspaper, reports.
Primary Data: Primary data for this study was carried out with the help of standardized questionnaire taken from various marketing and leadership stalwarts like Kouzes and Posner, Dave Ulrich, Philip Kotler, wherein all the employees of various departments of MNC and Indian National company of pharmaceutical companies were the respondents. Various levels of management across all the departmental were also interviewed to understand the actual level of competencies required. The departments covered were Marketing, Sales, Production, R &D, HR/ Admin, Accounts, Logistics, Purchase, Production and Environmental Health.
Secondary Data: Secondary data was collected from the previous research work conducted, job descriptions, performance appraisal reports, magazines, internet, journals and books.
Data Collection Instrument
The construction of a research instrument or tool for data collection is the most important aspect of a research project because findings or conclusions is based upon the type of information collected, and the data gathered is entirely dependent upon the questions asked to respondents. The research tool provides the input into a study and therefore the quality and validity of the output (the findings), are solely dependent on it. Standardized Questionnaire was prepared in order to collect the data from the respondents. The questionnaire was close-ended with five-point Likert scale. Questionnaire is used to gather data by asking questions from people who are thought to have the desired information. The Likert scales are developed by employing item analysis approach where a particular item is evaluated on the basis of how well it discriminates between those persons whose total score is high and those whose score is low. In this scale the respondent responds to each of the statement in terms of several degrees usually five degrees of agreement or disagreement. These five points constitute the scale as per the
below mentioned figure.

Strongly Agree (4) Undecided (3) Disagree (2) Strongly Disagree (1)
Agree (5)
In this present questionnaire (Figure 28) at one extreme of the scale there is Strong agreement with the given statement (5) and at the other Strong disagreement (1) and between them lie intermediate points. Each point on the scale carries a score. Response indicating the least favourable degree is given the least score and the most favourable is given the highest score.
Questionnaire Mapping:
Standardized Questionnaire was prepared by referring competencies from various Marketing and Leadership Gurus. Questions related to customer focused leadership such as
Table No. 15: Questionnaire Mapping
Questionnaire Mapping:
Standardized Questionnaire was prepared by referring competencies from various Marketing and Leadership Gurus. Questions related to customer focused leadership such as
Table No.1: Questionnaire Mapping
| S. No. | Sub-Scale of Competency mapping | Extracted from |
| 1 | Master Thinker | Ram Charan, 2007 |
| 2 | A great Communicator and a Skilled Builder of Relationships and Networks | Dianna Booher,1994 |
| 3 | A Wonderful Team player | Jonr Catznbach and Douglas K. Smith,1993 |
| 4 | A Live Example to Deciding, Acting, Delivering and Staying Fast | Bill Gates, 2000 |
| 5 | A Lifelong Learner for High Technical Expertise (Related to concerned discipline) | Kotler, P. (2003) |
| 6 | MODEL the Way | Kouzes J.M and Posner, B. Z. (2017); (Dave Ulrich et all 2007, Leadership Brand) |
| 7 | INSPIRE a shared vision | Kouzes J.M and Posner, B. Z. (2017); (Dave Ulrich et all 2007, |
| Leadership Brand) | ||
| 8 | CHALLENGE the process | Kouzes J.M and Posner, B. Z. (2017); (Dave Ulrich et all 2007, Leadership Brand) |
| 9 | ENABLE others to Act | Kouzes J.M and Posner, B. Z. (2017); (Dave Ulrich et all 2007, Leadership Brand) |
| 10 | Encourage the Heart | Kouzes J.M and Posner, B. Z. (2017); (Dave Ulrich et all 2007, Leadership Brand) |
The list of competencies was derived based on the literature reviewed. The questions were derived based on the research work of: Kouzes and Posner (2017), Philip Kotler (2003,2011), Dave Ulrich (2005, 2007, 2013, 2015), Ram Charan (2007), Dianna Booher (1994), Jonr Katznbach, Douglas K. Smith, (1993), Bill Gates (2000)
Statistical Tools
The analysis of the data helps the researcher to reach conclusion and findings of the study. Appropriate statistical techniques will be used in the study to analyze data. In the present research, after the data collection, descriptive and quantitative analysis was used. Study will employ mixed methods both Descriptive and Quantitative analysis. Statistical techniques like Descriptive statistics, independent sample ‘t’ test, ANOVA have been employed for analysis. Competency score is calculated by taking descriptive competency indicators. Mainly we have tried to find out score for energetic leader on the basis of employee’s perception of various descriptions of this component in five-point rating scale. As some of the components do not have much variation s across observations, simple average score is used instead the score by Principal component analysis. Multiple linear regression model will be employed to identify the important determinants of competency mapping score on a cross-sectional frame work.
The following model will be used to examine the predictors of competency mapping score.
Energetic leader Competency Score:
Y = a+b1Income + b2 Edn+b3 D_Nature of company+b4 Mid-level management dummy+b5 Top level management dummy+ b6 Communication level+e
Y: Dependent Variable, Avg. score of Competency, Multiple Linear Regression Model Independent Variable: Education, Income, Communication, level of management….Ordinary Least square (OLS) technique will be employed to find regression co-efficient of determinants
Diagnostic tests will be applied to check regression problems. Multiple Regression is the most widely used technique when there is more than one independent variable. It is used to check the impact of more than one independent variables on dependent variable. The main objective of linear regression is to explain the variation in one variable dependent variable) based on the variation on one or more variables (independent variables). One-way Anova is analysis of variance in the context of all those situations where one wants to compare more than two groups.
4. Research Discussion and Empirical Results
In the lines of methodology outlined in methodology chapter, in continuation, empirical results are reported and discussed. Results reported are classified in various sections such as Behavioural descriptors of competencies of Customer focused leadership (Competencies recommended), Selected competencies across level of companies, selected competency score across levels of management and determinants of perception-based competency score.
- Behavioural descriptors of competencies of Customer focused leadership Table 2- shows the base line characteristics of respondents participated in the survey.
Table 2: Base Line Characteristics of Respondents (Total Sample size:110) (Objective 1)
| Baseline characteristics of Respondents | VESTERGAARD FRANDSEN | Sumitomo Chemical | Ajay Biotech | |||||||
| Frequency | Percent | Freq uenc y | Perce nt | Frequ ency | Perc ent | |||||
| Age | Less than 25 years | 0 | 0 | 0 | 0 | 4 | 6.7 | |||
| 25-35 years | 1 | 5 | 4 | 19 | 22 | 36.7 | ||||
| 35- 45 years | 8 | 40 | 11 | 52.4 | 17 | 28.3 | ||||
| Above 45 years | 11 | 55 | 6 | 28.6 | 17 | 28.3 | ||||
| Educati on | Primary school level | 0 | 0 | 0 | 0 | 0 | 0 | |||
| Secondary school level | 0 | 0 | 0 | 0 | 0 | 0 | ||||
| Higher secondary school level | 0 | 0 | 0 | 0 | 0 | 0 | ||||
| Degree | 20 | 100 | 21 | 100 | 60 | 100 | ||||
| monthl y income | Below Rs.15,000 | 0 | 0 | 0 | 0 | 0 | 0 | |||
| Rs.15,001 – 30,000 | 0 | 0 | 0 | 0 | 10 | 16.7 | ||||
| Rs. 30,001-50 ,000 | 0 | 0 | 4 | 19 | 18 | 30 | ||||
| Above Rs. 50,000 | 20 | 100 | 17 | 81 | 32 | 53.3 | ||||
| marital status | Single | 0 | 0 | 0 | 0 | 25 | 35 | |||
| Married | 20 | 100 | 21 | 100 | 44 | 63.3 | ||||
| Experie | Up to 5 years | 6 | 30 | 4 | 19 | 38 | 63.3 | |||
| nce | 6-10 years | 4 | 20 | 11 | 52.4 | 6 | 10 |
| Above 10 years | 10 | 50 | 6 | 28.6 | 16 | 26.7 | |
| no of childre n | Nil | 0 | 0 | 2 | 9.5 | 14 | 23.3 |
| One | 14 | 70 | 11 | 52.4 | 21 | 35 | |
| Two | 6 | 30 | 7 | 33.3 | 13 | 21.7 | |
| More than two | 0 | 0 | 1 | 4.8 | |||
| birth order | First | 9 | 45 | 6 | 28.6 | 29 | 48.3 |
| Second | 11 | 55 | 11 | 52.4 | 28 | 46.7 | |
| Third | 0 | 0 | 2 | 9.5 | 1 | 1.7 | |
| others | 0 | 0 | 2 | 9.5 | 0 | 0 | |
| Compe tency mappin g | Yes | 20 | 100 | 21 | 100 | 0 | 0 |
| No | 0 | 0 | 0 | 0 | 60 | 100 | |
| year of compet ency mappin g | Early 2020 | 100 | Early 2019 | 100 | not respon ded | 0 |
Source: Computed by Authors using SPSS
Respondents have been classified across companies on the basis of demographic factors, experience, income and competency mapping of the company where they are employed. the Results are shown in table-2. It is observed from the table that in Vestergaard Frandsen as high as 55 percent respondents are above 45 years. Similarly, when maximum employees (52 percent) in Sumitomo Chemical are in 35-45 years, in Ajay Biotech maximum employees (36.7 percent) are in the age group of 25-35 years.
While looking at education, all respondents have completed their graduations. It suggested that employees in the companies are mostly graduates. For indicator of experience, it is observed from the table that in Vestergaard Frandsen as high as 50 percent respondents are above 10 years of experience. Similarly, when maximum respondent’s 52.4 percent in Sumitomo Chemical have experience of 6 to 10 years, in Ajay Biotech maximum respondents’ 63.3 percent have experience of up to 5 years.
While looking at monthly income in table 2 it is observed that for Vestergaard Frandsen all the respondents have salary package of more than Rs 50,000/-. Likewise maximum respondents’ 81 percent for Sumitomo Chemicals have salary package of more than Rs 50,000/-, in Ajay Biotech maximum respondents 53.3 % have salary package of more than Rs 50,000/-.
While looking at Competency Mapping in table 2 it is observed that both MNC’s Vestergaard
Frandsen and Sumitomo Chemicals have implemented competency mapping while Indian National Ajay Biotech is yet to implement competency mapping in their organization.
Scale: All Variables
Case Processing Summary
| N | % | ||
| Cases | Valid | 110 | 100.0 |
| Excludeda | 0 | .0 | |
| Total | 110 | 100.0 | |
The case processing summary shows that 110 cases were assigned to the training sample, out of which 110 cases were excluded from the analysis.
a. Listwise deletion based on all variables in the procedure.
Reliability Statistics
| Cronbach’s Alpha | N of Items |
| .709 | 9 |
For total 9 samples croanbach value is 0.709 which is greater than 0.5 Shows that data is acceptable and good.
Descriptive statistics have been found for key competency descriptors such as Energetic leader (table-3) , master thinker ( table4) and lifelong learner of technical expertise ( table5) to assess whether we can use principal component analysis to make a competency index for analysis.
Table-3: An Energetic Leader who Initiate, Execute, Influence and Inspire: Model the Way (Total Sample size:110) (Objective 2)
Descriptive Statistics
Source: Authors own compilation
| Behavioural Descriptors | N | Minimum | Maximum | Mean | Std. Deviation | Variance | |
| Statistic | Statistic | Statistic | Statistic | Std. Error | Statistic | Statistic | |
| Having a clear sense of mission knowing where we are headed and seeing the end | 110 | 5.00 | 5.00 | 5.0000 | .00000 | .00000 | .000 |
| Doing all that builds trust and practice integrity | 110 | 5.00 | 5.00 | 5.0000 | .00000 | .00000 | .000 |
| Being able to take a judicious decision in the absence of clear picture, precedents and guidelines. | 110 | 5.00 | 5.00 | 5.0000 | .00000 | .00000 | .000 |
| Going the extra mile to seize the opportunity for challenging and bigger initiatives. | 110 | 4.00 | 5.00 | 4.4059 | .04911 | .49352 | .244 |
| Being able to uncover the gifted abilities of other individual. | 110 | 4.00 | 4.00 | 4.0000 | .00000 | .00000 | .000 |
| Strategists: Leaders need to have a point of view about the future and be able ton position the firm for future customers. | 110 | 4.00 | 5.00 | 4.4059 | .04911 | .49352 | .244 |
| Displaying good peripheral vision for how to scope, scan and interpret signals hidden in plain sight. | 110 | 3.00 | 5.00 | 3.8119 | .09821 | .98704 | .974 |
| Engaging everyone shopping for ideas, search for the best practices as well as the “next practice” | 110 | 4.00 | 4.00 | 4.0000 | .00000 | .00000 | .000 |
| Being able to consistently invest the majority of his time in fewer areas that produce greatest results. | 110 | 4.00 | 4.00 | 4.0000 | .00000 | .00000 | .000 |
| Knowing what causes momentum in the organization and how to keep it going | 110 | 3.00 | 4.00 | 3.4059 | .04911 | .49352 | .244 |
| Valid N (listwise) | 110 |
Source: Computed by author using SPSS
Case Processing Summary
| N | % | ||
| Cases | Valid | 110 | 100.0 |
| Excludeda | 0 | .0 | |
| Total | 110 | 100.0 | |
a. Listwise deletion based on all variables in the procedure.
The case processing summary shows that 110 cases were assigned to the training sample, out of which 110 cases were excluded from the analysis.
Reliability Statistics
| Cronbach’s Alpha | N of Items |
| .729 | 11 |
For total 11samples croanbach value is 0.729 which is greater than 0.5 shows that data is acceptable is good
Table-4 :A Master Thinker (Total Sample size:110)
Descriptive Statistics, Source: Authors own compilation (Objective 1)
| Behavioural Descriptors | N | Minimum | Maximum | Mean | Std. Deviation | Variance | |
| Statistic | Statistic | Statistic | Statistic | Std. Error | Statistic | Statistic | |
| Challenge the status=quo and ask incisive questions that open minds and incite the imagination. | 110 | 4.00 | 5.00 | 4.5941 | .04911 | .49352 | .244 |
| With aero gravity thinking, create an open source approach to searching for opportunities. | 110 | 4.00 | 4.00 | 4.0000 | .00000 | .00000 | . 000 |
| Engage everyone shopping for ideas. | 110 | 4.00 | 5.00 | 4.5941 | .04911 | .49352 | .244 |
| Picking up early warning signals of issues that are just emergent or gaining traction. | 110 | 4.00 | 5.00 | 4.5941 | .04911 | .49352 | .244 |
| Envision the future by imagining ennobling possibilities. | 110 | 5.00 | 5.00 | 5.0000 | .00000 | .00000 | .000 |
| Have the personal imagination to construct patterns from emerging disparate trends. | 110 | 5.00 | 5.00 | 5.0000 | .00000 | .00000 | .000 |
| Always search for the missing links and missing ingredients. | 110 | 5.00 | 5.00 | 5.0000 | .00000 | .00000 | .000 |
| Develops methodologies for anticipating and detecting breaks in the continuity of the external landscape to pinpoint “WHAT IS NEXT” | 110 | 4.00 | 5.00 | 4.4059 | .04911 | .49352 | .244 |
| HR Professional Should be the Master Thinkers in the Organization with Respect to Manpower and Organizational Issues | 110 | 3.00 | 5.00 | 3.8119 | .09821 | .98704 | .974 |
| Valid N (listwise) | 110 |
![]()
![]() Source: Computed by author using SPSS
Source: Computed by author using SPSS
Scale: All Variables
Case Processing Summary
| N | % | ||
| Cases | Valid | 21 | 100.0 |
| Excludeda | 0 | .0 | |
| Total | 21 | 100.0 | |
The case processing summary shows that 21 cases the 0 cases excluded from the analysis
a. Listwise deletion based on all variables in the procedure.
Reliability Statistics
| Cronbach’s Alpha | N of Items |
| .709 | 9 |
For total 9 samples Cronbach’s value is 0.709 which is greater than 0.5 shows that data is acceptable is good
![]()
![]()
![]()
![]() Table 5: A Lifelong Learner for High Technical Expertise (Related to concerned discipline) (Total Sample size:110) (Objective 1)
Table 5: A Lifelong Learner for High Technical Expertise (Related to concerned discipline) (Total Sample size:110) (Objective 1)
Descriptive Statistics, Source: Authors own compilation
| Behavioural Descriptors | N | Minimum | Maximum | Mean | Std. Deviation | Variance | |
| Statistic | Statistic | Statistic | Statistic | Std. Error | Statistic | Statistic | |
| Convincingly present features and benefits to customers. | 110 | 4.00 | 5.00 | 4.4059 | .04911 | .49352 | .244 |
| Making sure that customer orders are filled correctly and delivered on time. | 110 | 4.00 | 5.00 | 4.4059 | .04911 | .49352 | .244 |
| Checking that customers have received proper instructions, training, and technical assistance in the use of the product. | 110 | 4.00 | 5.00 | 4.4059 | .04911 | .49352 | .244 |
| Seize every opportunity to stay in touch with customers after the sale to ensure that they are satisfied. | 110 | 4.00 | 4.00 | 4.0000 | .00000 | .00000 | .000 |
| Mapping customer perceptions, preferences, and requirements. | 110 | 4.00 | 4.00 | 4.0000 | .00000 | .00000 | .000 |
| Communicating customer wants and expectations to product designers. | 110 | 4.00 | 5.00 | 4.5941 | .04911 | .49352 | .244 |
| Gathering customer ideal for product and service improvements and conveying then to the appropriate departments. | 110 | 4.00 | 5.00 | 4.5941 | .04911 | .49352 | .244 |
| Innovate and establish new channels for effective delivery of products and services. | 110 | 4.00 | 5.00 | 4.5941 | .04911 | .49352 | .244 |
| Give accurate leads on what to innovate and where to position a product. | 110 | 5.00 | 5.00 | 5.0000 | .00000 | .00000 | .000 |
| Architect the introduction of a new product or services with benchmark speed to market. | 110 | 5.00 | 5.00 | 5.0000 | .00000 | .00000 | .000 |
| Map and Target Prospects with high accuracy. | 110 | 3.00 | 5.00 | 3.8119 | .09821 | .98704 | .974 |
| Constantly builds cross functional expertise in managing People, Finance and IT applications to assume higher responsibilities. | 110 | 4.00 | 5.00 | 4.4059 | .04911 | .49352 | .244 |
| HR should see itself as a fundamental source of competitive advantage and advantage and create practices that support it. | 110 | 4.00 | 5.00 | 4.4059 | .04911 | .49352 | .244 |
| Valid N (listwise) | 110 |
Source: Computed by author using SPSS
Case Processing Summary
| N | % | ||
| Cases | Valid | 21 | 100.0 |
| Excludeda | 0 | .0 | |
| Total | 21 | 100.0 | |
The case processing summary shows that 21 cases The 0 cases excluded from the analysis
a. Listwise deletion based on all variables in the procedure.
Reliability Statistics
| Cronbach’s Alpha | N of Items |
| .766 | 42 |
For total 42 samples croanch value is 0.766 which is greater than 0.5 Shows that data is acceptable is good
Table 6: A great Communicator and a Skilled Builder of Relationships and Networks (Total Sample size:110) (Objective 1)
Descriptive Statistics, Source: Authors own compilation
| Behavioural Descriptors | N | Ran ge | Mini mum | Maxi mum | Sum | Mean | Std. Devi ation | Vari ance | ||
| Stati stic | Stati stic | Statis tic | Statist ic | Stati stic | Stati stic | Std. Err or | Statis tic | Stati stic | ||
| 1 | Create places and opportu nities for informa l interact ion. | 110 | 2 | 3 | 5 | 423 | 4.19 | .09 8 | .987 | .974 |
| 2 | Remem ber others names. | 110 | 0 | 3 | 3 | 123 | 3.00 | .00 0 | .000 | .000 |
| 3 | Encour age other to vent their emotio ns. | 110 | 0 | 3 | 3 | 123 | 3.00 | .00 0 | .000 | .000 |
| 4 | Recogn ize the body languag e of resistan ce and the implica tion of what is not said. | 110 | .00 | 5.00 | 5.00 | 300. 00 | 5.00 00 | .00 0 | .000 | .000 |
| 5 | Avoid – steppin g on other’s sentenc e, overloa ding informa tion to the point of distorti on, ending every stateme nt with a questio n, overloo king good advice because of packagi ng, giving premat ure feedbac k or advice. | 110 | .00 | 5.00 | 5.00 | 300. 00 | 5.00 00 | .00 0 | .000 | .000 |
| 6 | Criticiz e the view point or behavio r not the | 110 | .00 | 5.00 | 5.00 | 300. 00 | 5.00 00 | .00 000 | .0000 0 | .000 |
| person. | ||||||||||
| 7 | Quickl y relate well to people of diverse backgro unds and integrit y. | 110 | 1 | 4 | 5 | 464 | 4.59 | .04 9 | .494 | .244 |
| 8 | Know when small talk is appropr iate. | 110 | 0 | 4 | 4 | 164 | 4.00 | .00 0 | .000 | .000 |
| 9 | Knows how to probe with open ended questio ns and how to ask closed questio ns to gain agreem ent. | 110 | 0 | 4 | 4 | 164 | 4.00 | .00 0 | .000 | .000 |
| 1 0 | Organiz e ideals for greatest impact. | 110 | 0 | 5 | 5 | 205 | 5.00 | .00 0 | .000 | .000 |
| 1 1 | Has a rich | 110 | 0 | 5 | 5 | 205 | 5.00 | .00 0 | .000 | .000 |
| archive of best- selling words. | ||||||||||
| 1 2 | Lead the person to do a self- critique . | 110 | 0 | 5 | 5 | 205 | 5.00 | .00 0 | .000 | .000 |
| 1 3 | Move people from emotio nal level to analytic al level. | 110 | .00 | 5.00 | 5.00 | 300. 00 | 5.00 00 | .00 000 | .0000 0 | .000 |
| 1 4 | Valid N (listwis e) | 110 |
Source: Computed by author using SPSS
Table 6 shows the descriptive observation of a variable (a great communicator and a skilled builder of relationships and networks). It has been observed that many parameters have zero standard deviation, standard error, and variance such as 1to 6, and 8 to 13, due to respondents have responded similarly. Respondents have responded differently for Only 1st and 7th parameter. It has been observed that standard deviation, and variance for the 1st and 7th parameter are 0.987 and 0.974, 0.494 and 0.244 respectively.
Case Processing Summary
| N | % | ||
| Cases | Valid | 110 | 100.0 |
| Excludeda | 0 | .0 | |
| Total | 110 | 100.0 | |
The case processing summary shows that 110 cases The 0 cases excluded from analysis.
Reliability Statistics
Cronbach’s
Alpha N of Items
| .894 | 39 |
For total 39 samples cronbach’s value is 0.894 which is greater than 0.5 shows that data is acceptable
Table 7: INSPIRE a shared vision (Total Sample size:110) Descriptive Statistics, Source: Authors own compilation (Objective 1)
| Descriptive Statistics | ||||||||||
| Behavioural Descriptors | N | Ran ge | Mini mum | Maxi mum | Sum | Mean | Std. Devi ation | Vari ance | ||
| Stati stic | Stati stic | Statis tic | Statist ic | Stati stic | Stati stic | St d. Er ror | Statis tic | Stati stic | ||
| 1 | Discoveri ng a compelli ng common ground in every vision | 110 | 1 | 4 | 5 | 445 | 4.41 | .0 49 | .494 | .244 |
| 2 | Engaging the team members in a dialogue about their hopes, dreams, and aspiration s | 110 | 1 | 4 | 5 | 445 | 4.41 | .0 49 | .494 | .244 |
| 3 | Convinci ngly articulati ng the vision of the future to the members of his team | 110 | 0 | 4 | 4 | 404 | 4.00 | .0 00 | .000 | .000 |
| 4 | Executers : Leaders need to be able to make things happen in order to deliver results by sharing the vision to all. | 110 | 1 | 4 | 5 | 464 | 4.59 | .0 49 | .494 | .244 |
| 5 | Generatin g buy-in of solo experts to practice the power of collective “group think” | 110 | 0 | 5 | 5 | 505 | 5.00 | .0 00 | .000 | .000 |
| 6 | Commun icating the common vision in an attractive , | 110 | 1 | 3 | 4 | 344 | 3.41 | .0 49 | .494 | .244 |
| appealing way with best selling words, imagery and metaphor s | ||||||||||
| 7 | Valid N (listwise) | 110 |
Source: Computed by author using SPSS
Table7 shows the descriptive observation of a variable (INSPIRE a shared vision). It has been observed that all the parameters have same standard deviation, standard error, and variance 0.494, 0.049, and .244 except 5th parameter.
N % Cases Valid 110 100.0 Excludeda 0 .0 Total 110 100.0 Case Processing Summary
The case processing summary shows that 110 cases The 0 cases excluded from the analysis
Reliability Statistics
| Cronbach’s Alpha | N of Items |
| .814 | 18 |
For total 18 samples cronbach’s value is 0.814 which is greater than 0.5 Shows that data is acceptable
Table 8: CHALLENGE the process (Total Sample size:110) Descriptive Statistics, Source: Authors own compilation (Objective 1)
| Descriptive Statistics | ||||||||
| Behavioural Descriptors | N | Ran ge | Mini mum | Maxi mum | Sum | Mean | Std. Devia | Varia nce |
| tion | ||||||||||
| Stati stic | Stati stic | Statis tic | Statist ic | Stati stic | Stati stic | St d. Er ror | Statis tic | Statis tic | ||
| 1 | Asking incisive questio ns that open minds and incite the imagina tion. | 110 | 0 | 5 | 5 | 505 | 5.00 | .0 00 | .000 | .000 |
| 2 | Having the courage to say no on logical grounds , even to influent ial and powerf ul people and even if it will make them unhapp y or upset. | 110 | 1 | 4 | 5 | 445 | 4.41 | .0 49 | .494 | .244 |
| 3 | Challen ging the status- quo in the absence of a blessing or “buy- in” from key individ uals in the organiz ation. | 110 | 0 | 4 | 4 | 404 | 4.00 | .0 00 | .000 | .000 |
| 4 | Persona l Proficie ncy : Make bold and courage ous decisio ns and build trust. | 110 | 0 | 4 | 4 | 404 | 4.00 | .0 00 | .000 | .000 |
| 5 | Having great Emotio nal Quotien t to stay on course even if | 110 | 1 | 4 | 5 | 445 | 4.41 | .0 49 | .494 | .244 |
| fatigued or discour aged. | ||||||||||
| 6 | Valid N (listwis e) | 110 |
Source: Computed by author using SPSS
Table 8 shows the descriptive observation of a variable (CHALLENGE the process). It has been observed that many parameters have zero standard deviation, standard error, and variance such as 1st ,3rd, and 4th due to respondents have responded similarly. Furthermore, the parameters 2nd and 4th have same standard deviation, standard error, and variance 0.494, 0.049, and 0.244.
Case Processing Summary
| N | % | ||
| Cases | Valid | 110 | 100.0 |
| Excludeda | 0 | .0 | |
| Total | 110 | 100.0 | |
The case processing summary shows that 110 cases the 0 cases excluded from the analysis
Reliability Statistics
| Cronbach’s Alpha | N of Items |
| .841 | 15 |
For total 15 samples croanch value is 0.841 which is greater than 0.5 Shows that data is acceptable
Table 9: ENABLE others to Act (Total Sample size:110) (Objective 1) Descriptive Statistics, Source: Authors own compilation
| Descriptive Statistics | ||||||||||
| Behaviou ral Descripto rs | N | Ran ge | Mini mum | Maxi mum | Sum | Mean | Std. Devi ation | Vari ance | ||
| Stati stic | Stati stic | Statis tic | Statis tic | Stati stic | Stati stic | Std . Err or | Statis tic | Stati stic | ||
| 1 | Commun icating an activity with a clear line of sight to business outcomes | 110 | 0 | 5 | 5 | 505 | 5.00 | .00 0 | .000 | .000 |
| 2 | Enlargin g people’s sphere of influence and strengthe ning others by sharing power and discretio n. | 110 | 0 | 5 | 5 | 505 | 5.00 | .00 0 | .000 | .000 |
| 3 | Creating a climate for learning and always encourag ing reverse mentorin g. | 110 | 0 | 5 | 5 | 505 | 5.00 | .00 0 | .000 | .000 |
| 4 | Human Capital Develope rs: Leaders need to work on | 110 | 1 | 4 | 5 | 464 | 4.59 | .04 9 | .494 | .244 |
| their future employee s to delegate and build future talent. | ||||||||||
| 5 | Making it safe for others to experime nt. | 110 | 0 | 5 | 5 | 505 | 5.00 | .00 0 | .000 | .000 |
| 6 | Providin g challengi ng and value added stretched assignme nts for all of his direct reports. | 110 | .00 | 5.00 | 5.00 | 300. 00 | 5.00 00 | .00 000 | .0000 0 | .000 |
| 7 | Is able to go for small and big wins together on a consisten t basis | 110 | 2 | 3 | 5 | 385 | 3.81 | .09 8 | .987 | .974 |
| 8 | Having the courage to give honest feedback so that his direct | 110 | 0 | 5 | 5 | 505 | 5.00 | .00 0 | .000 | .000 |
| reports could learn and grow. | ||||||||||
| 9 | Valid N (listwise) | 110 |
Source: Computed by author using SPSS
Table 9 shows the descriptive observation of a variable (ENABLE others to Act). It has been observed that many parameters have zero standard deviation, standard error, and variance such as 1st, 2nd, 3rd, 5th, 6th, and 8th due to respondents have responded similarly. Furthermore, the 4th parameter has standard deviation (0.494), standard error (0.049), and variance (0.244). The 7th parameter has standard deviation (0.987), standard error (0.98), and variance (0.974).
Case Processing Summary
| N | % | ||
| Cases | Valid | 110 | 100.0 |
| Excludeda | 0 | .0 | |
| Total | 110 | 100.0 | |
The case processing summary shows that 110 cases The 0 cases excluded from the analysis
Reliability Statistics
Cronbach’s
Alpha N of Items
| .724 | 21 |
For total 21 samples cronbach’s value is 0.724 which is greater than 0.5 Shows that data is acceptable is good
Table 10: ENCOURAGE the Heart (Total Sample size:110) Descriptive Statistics, Source: Authors own compilation (Objective 1)
| Descriptive Statistics | ||||||||||
| Behavio ural Descript ors | N | Ran ge | Mini mum | Maxi mum | Sum | Mean | Std. Devia tion | Vari ance | ||
| Stati stic | Stati stic | Statis tic | Statist ic | Stati stic | Stati stic | St d. Er ror | Statis tic | Stati stic | ||
| 1 | Relating to people more head-to- head and heart- to-heart. | 110 | 1 | 4 | 5 | 445 | 4.41 | .0 49 | .494 | .244 |
| 2 | Adding fun to everyon e’s work | 110 | 1 | 3 | 4 | 344 | 3.41 | .0 49 | .494 | .244 |
| 3 | Infusing energy, hope and joy into the lives of the people that you relate to. | 110 | 1 | 4 | 5 | 445 | 4.41 | .0 49 | .494 | .244 |
| 4 | Talent Manage rs: Leaders need to work with their current employ ees to motivat e, commu nicate and encoura | 110 | 1 | 4 | 5 | 445 | 4.41 | .0 49 | .494 | .244 |
| ge them. | ||||||||||
| 5 | Persona lizing recognit ions and making every celebrat ion memora ble. | 110 | 0 | 4 | 4 | 404 | 4.00 | .0 00 | .000 | .000 |
| 6 | Making every relation ship to last for a lifetime. | 110 | 0 | 3 | 3 | 303 | 3.00 | .0 00 | .000 | .000 |
| 7 | Valid N (listwise ) | 110 |
Source: Computed by author using SPSS
Table 10 shows the descriptive observation of a variable (ENCOURAGE the Heart). It has been observed that all the parameters have same standard deviation, standard error, and variance 0.494, 0.049, and .244 except 5th and 6th parameter.
It is observed that for many of sub- components variance is close to zero . As a result it is not possible to calculate PCA. So we have taken a simple average of sub-components to find the score for each indicator and simple average score of all indicators for competency score .
Case Processing Summary
| N | % | ||
| Cases | Valid | 110 | 100.0 |
| Excludeda | 0 | .0 | |
| Total | 110 | 100.0 | |
The case processing summary shows that 110 cases The 0 cases excluded from the analysis
Reliability Statistics
Cronbach’s
Alpha N of Items
| .725 | 18 |
For total 18 samples cronbach’s value is 0.725 which is greater than 0.5 Shows that data is acceptable is good
4.2. Competency descriptors Across MNC and Indian Firms
In this subsection, a comparison is made for competency descriptors across Multinational company (MNC) and Indian Firms. Results are reported in Table-25. Independent samples “t” test is employed to verify whether there is significant differences in the mean score for each competency descriptors across MNC and Indian firms.
Table-11: Competency descriptors Across MNC and Indian Firms, Source: Annjaan Daash, et al, May 2020[5], Authors own compilation (Objective 4)
| Variables | MNC | Indian | |||||
| Freq. | % | Avg score | Freq. | % | Avg score | t-test | |
| Master thinker | 41 | 40.6 | 4.56 | 60 | 59.4 | 4.42 | 1.23 |
| An Energetic Leader who Initiate Execute Influence and Inspire | 41 | 40.6 | 4.6 | 60 | 59.4 | 4.1 | 3.23* |
| A Great Communicator and a Skilled Builder of Relationships and Networks | 41 | 40.6 | 4.0 | 60 | 59.4 | 5 | 2.21** |
| A Life long Learner for High Technical Expertise Related to concerned | 41 | 40.6 | 4.64 | 60 | 59.4 | 4.29 | 0.78 |
| A Wonderful Team player | 41 | 40.6 | 4.15 | 60 | 59.4 | 4.6 | 3.96* |
| A Live Example to Deciding Acting Delivering and Staying Fast | 41 | 40.6 | 4.17 | 60 | 59.4 | 3.92 | 0.45 |
*,** and *** indicate significance at 1 percent, 5percent and 10 percent level of significance
Source: computed by Author using SPSS
It is observed from Table-11 that there are significant differences across MNC and Indian pharmaceutical firms in the competency score for competency descriptors such as an energetic leader, a great communicator, and a wonderful team player. These are key indicators describing the competency mapping of companies. In these indicators , there are clear differences between MNC firms and Indian pharmaceutical firms.
However, for the descriptors such as master thinker, lifelong learner, acting delivering and staying fast did not emerge to be significant. The values of “t” statistic do not suggest to reject the equality of mean score for these indicators between MNC and Indian firms. When T-value is greater than equal to 1.96 it is considered to be significant.
Figure-1: Perception Score for descriptor an Energetic leader in Indian firms vs MNC
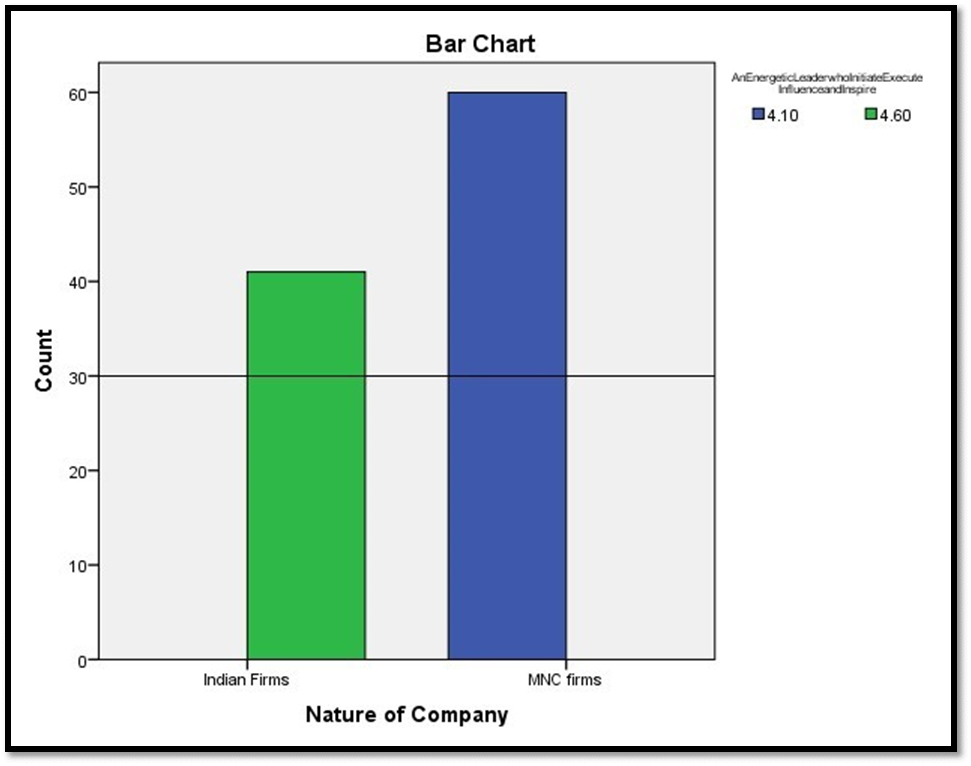
Source: Computed by author
From figure 1 it is observed that executives average perception score for energetic leader who Initiate Execute Influence and inspire is 4.10 out of 5 for Indian firms , while the same is 4.60 for MNC. The blue colour line is for MNC which is higher than the line indicated by green for Indian firms. The scale of Y-axis is multiplied by 10 to the actual value for visibility of bar diagrams.
Figure-2: Perception Score for Great Communicator and skilled builder of relationships and networks in Indian firms vs MNC
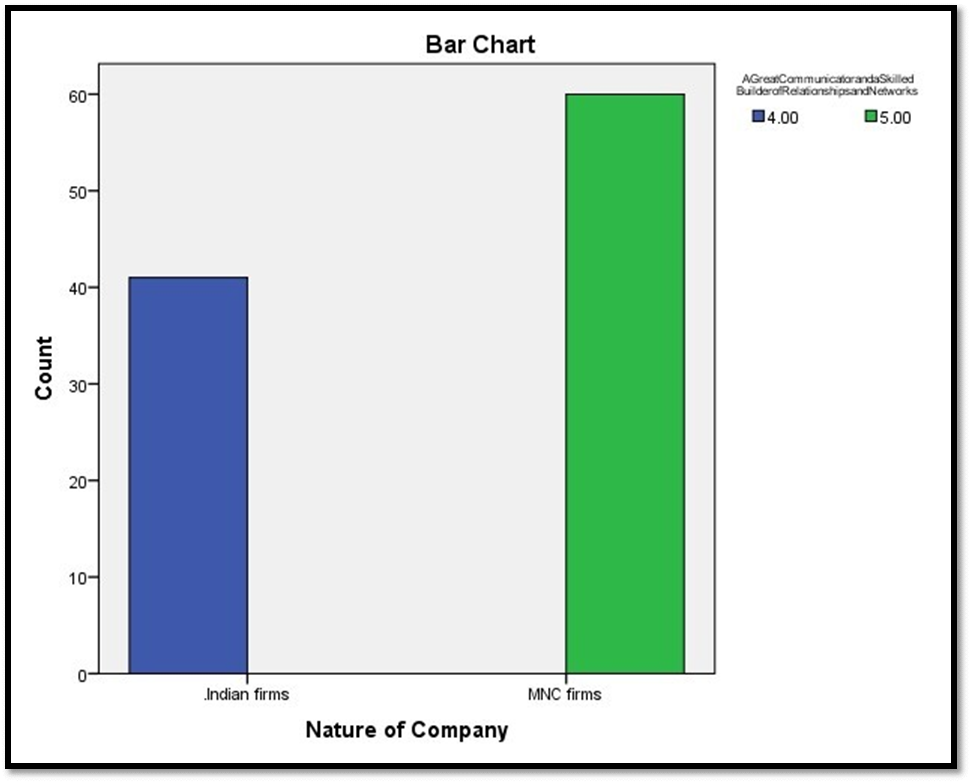
Source: Computed by author
Similarly in figure- 2 it is observed that the perception score for great communicator also varies across nature of companies such as Indian firms and MNC firms. While the score is 4.0 out of 5 for Indian firms , it is 5 out of 5 for MNC. This is also one of the important descriptors for leadership competency.
Figure-3: Perception Score for descriptor Life-long Learner of high technical expertise in Indian firms vs MNC
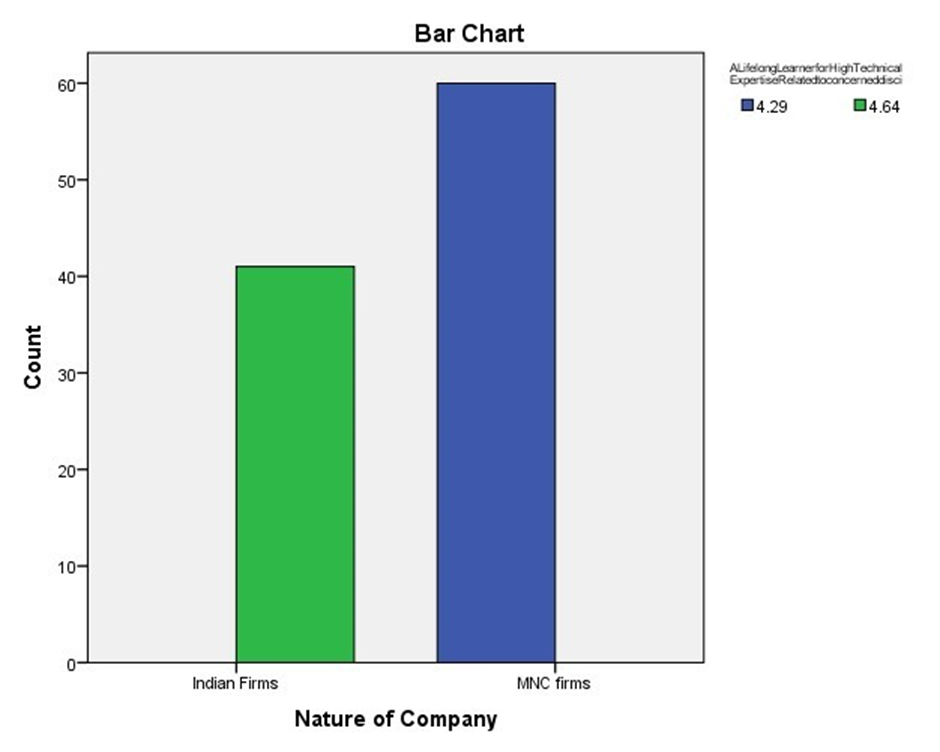
Source: Computed by author
Another important descriptor for assessing consumer focused leadership is life long learner for high technical expertise for the company. The perception score for this is also found to be better for MNC(4.64) than Indian firms( 4.29).
4.3. Leadership Competency Score Across levels of management
It is important to analyse how the perception score for competency management varies across level of management such as Lower level, mid-level and higher level of management. This is defined on the basis of experiences. Up to 5 years of experiences executives are categorized as lower-level management, mid-level management comprises of executives with experiences 6- 10 years, after 10 years’ experience they move higher level of management.
Frequency distribution of respondents across level of management in different companies are given in table-12
Table-12: Frequency distribution of respondents across different level of management (Total Sample Size: 110) (Objective 3)
| Frequency of Respondents Across level of Management | VESTERGAARD FRANDSEN | Sumitomo Chemical | Ajay Biotech | |||||
| Frequency | Percent | Frequency | Percent | Frequency | Percent | |||
| Lower Level | 6 | 30 | 4 | 19 | 37 | 53.6 | ||
| Mid- level | 5 | 25 | 13 | 62 | 15 | 21.7 | ||
| Higher level | 9 | 45 | 4 | 19 | 17 | 24.7 | ||
Source: Compiled by author
It is observed that 45 percent of respondents from Vestergaard Frandsen are from higher level of management. While 19 percent of respondents in Sumitomo chemical and 24.7 percent of respondents from Ajay Biotech are respectively in higher level of management. In Ajay biotech as high as 53.6 percent is from lower-level management. In Sumitomo chemical majority of respondents are from mid-level management.
However, without considering companies, the classification of frequencies of respondents for analysis for the overall sample is given in figure-32. It is observed that out of total respondents’ 27 percent ,30 percent and 43 percent are respectively from Higher, Mid-level and lower level management are considered for analysis.
Figure-4: Frequency of Respondents Across Management (Total Sample size 110)
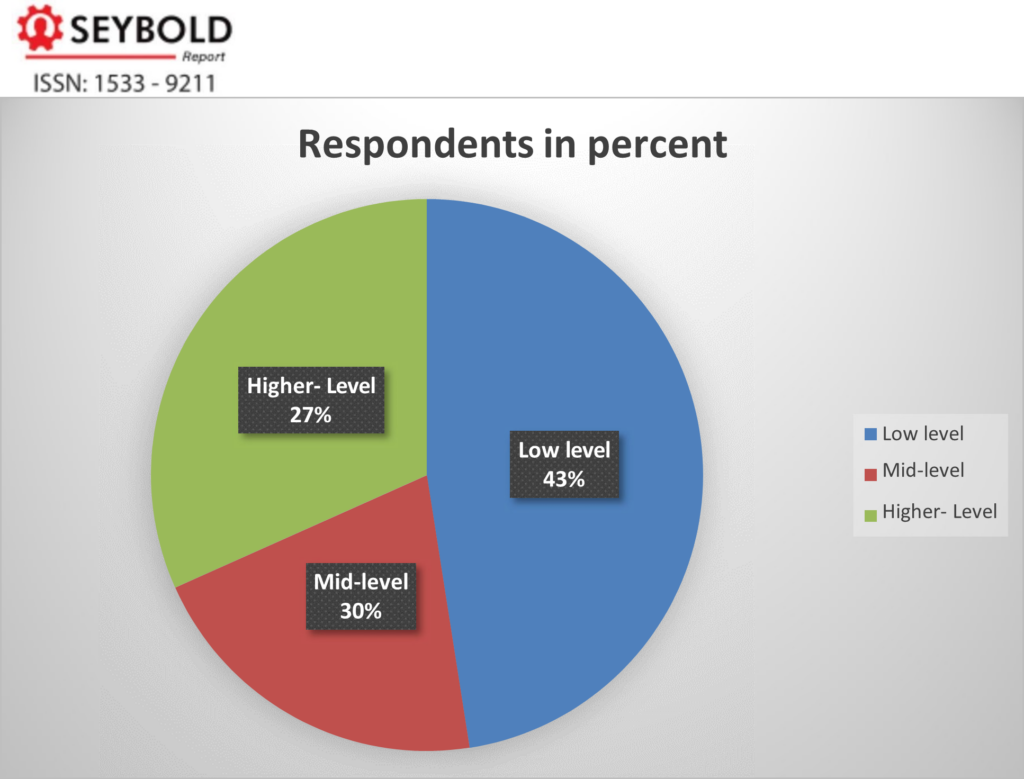
Source: Compiled by author
An attempt is made to observe the difference in employer’s perception score on an energetic leader who can execute, influence and inspire across different level of management. Result of One- way ANOVA is shown in table-27. Here energetic descriptor score is taken as dependent and Level of management is taken as factor.
Table13: ANOVA
An Energetic Leader who Initiates, Executes, Influence and Inspire
| Sum of Squares | df | Mean Square | F | Sig. | |
| Between Groups | 1.039 | 2 | .519 | 10.075 | .000 |
| Within Groups | 5.051 | 98 | .052 | ||
| Total | 6.089 | 100 |
Source: Compiled by author, SPSS
It is observed from the results of One- Way Analysis of variance (ANOVA), that there is significant differences in the mean simple average score for Energetic leader across higher, mid-level and lower level managements.
4.4. Determinants of Leadership competency Score
In this subsection an attempt is made to find out the key factors influencing leadership competency score. The average score for one of the key competency descriptors has been taken as dependent variable. The important variables used as predictor in the model are Monthly income, Education, Dummy for mid level management, Dummy for higher level management, Dummy for MNC, and Great commination
The descriptive statistics of variables used are given in table -28
Table-14 : Comparison of mean score across the different levels of management (Total Sample size: 110) (Objective 3)
| Variable | Observation | Mean | Standard Deviation | Min. | Max. |
| Energetic Leader | 110 | 4.30297 | 0.246761 | 4.1 | 4.6 |
| Education | 110 | 4 | 0 | 4 | 4 |
| Monthly income | 110 | 3.58415 8 | 0.667343 | 2 | 4 |
| Nature of Company | 110 | 0.59405 9 | 0.493522 | 0 | 1 |
| Dummy for mid level management | 110 | 0.31683 2 | 0.467562 | 0 | 1 |
| Dummy for higher level management | 110 | 0.20792 1 | 0.407844 | 0 | 1 |
| Great Communicator | 110 | 4.59405 9 | 0.493522 | 4 | 5 |
Source: Computed by Author using Stata
The results of regression coefficients are shown in table-29
Table-15: Regression Coefficients of
Simple average Score of Energetic leader who initiate, influence, execute and inspire
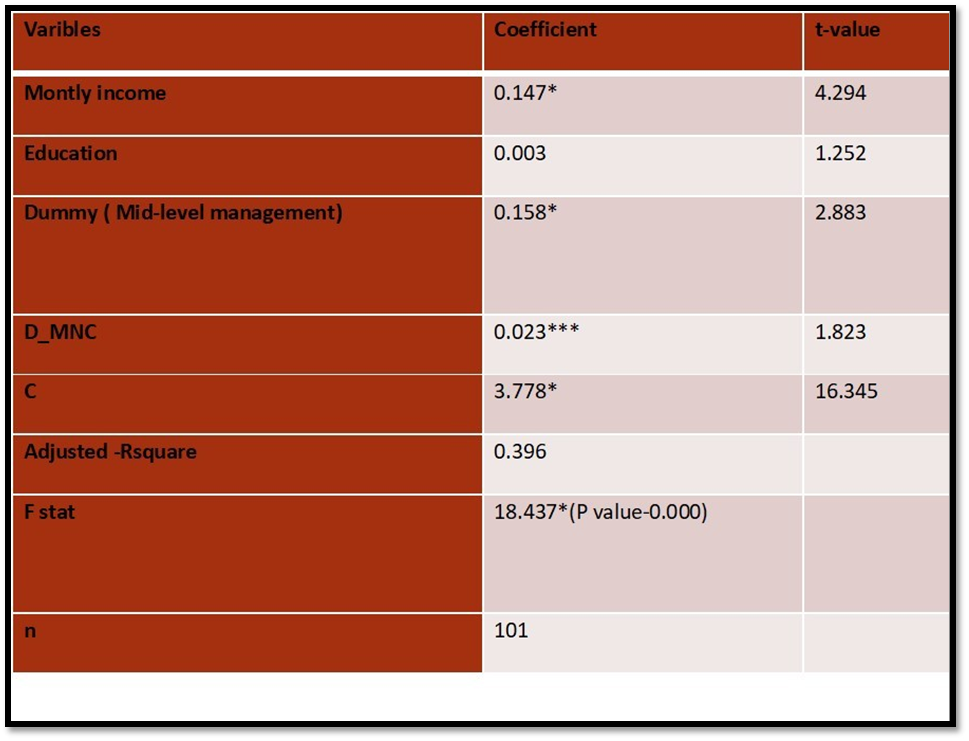
Source: Calculated by author using STATA
It is found from table -15 that Monthly income, Midlevel management dummy, MNC dummy emerged significant and positive in influencing energetic leader score. Moving from lower to midlevel management, the energetic score increases by 0.158 units. Monthly income emerged to be significant and it would positively influence the perception-based score for energetic leader.
When monthly income of executives changes by one level, energetic leader score increases by 0. 147 units. Income of executives is one of the factors that predict the energetic leader competencies. Another potential influence arises from Dummy MNC which is found to be positive and significant at 10 percent level of significance.
Moving from Indian firm to MNC pharmaceuticals, competency score for energetic leader increases by 0.023 units. This may be due to more better competency mapping, training to employees and incentives in the MNC firms.
However, Education did not emerge to be significant in influencing the score though the coefficient is positive. This is mainly because that mostly the respondents are graduates across companies.
Other variables like Communication, master thinker, Dummy_ higher level have been dropped
from the model because of high multicollinearity
As F- statistic value is high and significant at one percent level of significance, it indicates that there is overall significance of model. Besides, R- square value indicates that 39.6 percent of variations in the energetic leader competency perception score is explained by the fitted model, which is moderately well fit.
Conclusion
In the course of the survey, it was found that in majority of the cases the Competency Management Concept after an initial gaudiness was not religiously followed in organizations; rather in most cases it became a vogue to get elevated in the rating game like “Great place to work for”, Best employer” etc. In several cases competencies have not been defined level wise so that employees are not able to differentiate how the competency is demonstrated at different levels of competence.
This execution problem could be rectified if the competency management does not become the sole property of the HR Department. Competency management is the core asset which gives direction to other competitive dimensions in an organization. Hence to develop this core asset the HR Department should arrange at least a day of training or workshop for every employee under a skilled facilitator. This would create awareness on the competency framework and the business context to begin with and then ask each individual to draw a development plan of himself, his boss and his direct reports. This is one of the finest ways to institutionalize competency management in the organization as followed in some Fortune 500 companies.
Competency is a moving target. Any Competency Management Concept is not a onetime solution that will magically solve all problems forever. Hence an organization should always be considered as an unfinished prototype and keep trying, evolving and upgrading for better competency management framework which is difficult to imitate and will give a competitive advantage.
The positive ROI for the Dynamic Leadership program reflects its practical focus, thorough planning, well-managed implementation, rigorous post -program follow-through, and ongoing assessment.
Source: A. Daash et. al, 05,2020
It can be concluded that there are significant differences across MNC and Indian pharmaceutical firms in the competency score for competency descriptors such as an energetic leader, a great communicator and a wonderful team player, which are key indicators describing the competency mapping of companies. In these indicators, there are clear differences between MNC firms and Indian pharmaceutical firms.
However, for the descriptors such as master thinker, lifelong learner, acting, delivering and
staying fast did not emerge to be significant. The values of “t” statistic do not suggest to reject the equality of mean score for these indicators between MNC and Indian firms.
It can be also concluded that the Monthly income, Midlevel management dummy, MNC dummy emerged significant and positive in influencing energetic leader score. Moving from lower to midlevel management, the energetic score increases by 0.158 units. Monthly income emerged to be significant and it would positively influence the perception-based score for energetic leader. When monthly income of employees changes by one level, energetic leader score increases by 0. 147 units.
Income of employees is one of the factors that predict the energetic leader competencies. Another potential influence arises from Dummy MNC which is found to be positive and significant at 10 percent level of significance. Moving from Indian firm to MNC pharmaceuticals, competency score for energetic leader increases by 0.023 units. This may be due to more better competency mapping, training to employees and incentives in the MNC firms.
Future requirements of HR
A. Daash et. al, 05,2020, [4], Compiled by Author
Given the prospects of external change, we anticipate a future where human ingenuity and organization capability, as guided by the insightful line and HR leaders will emerge as the new frontier of competitive advantage.
Different global regions may take different paths to achieve competitive advantage but the agendas around talent, organization and leadership are similar. With emerging business conditions and HR granularity, we envision HR continuing to focus on the three demands; talent, organization and leadership. The competitive challenge is to make the organizational whole more productive than the sum of talented individuals. Leaders are the charge of bringing talent and organization together.
Leadership Future Trends
Leaders have the dual responsibility of sourcing talent and creating organization capabilities. As we contemplate leadership for the business context there are three trends:
From Command and Control to Coach, Collaborate and Communicate
Leaders get things done through others. In complex changing global organizations, leaders cannot govern by observing and telling others what to do. They have to get things done through the shared commitment to common goals. They need to enable others to act.
From Why and What to How
Better leadership boost customer share, productivity and financial performance. Leadership in future will increasingly attend to how leaders do what they know they should do. Leaders need to Model the way and challenge the process. It can be called as leadership sustainability and
believe that HR professionals should help leaders not only to figure our why and what they should do but also how to do it.
From Leader to Leadership
Leaders are the specific individuals who direct work, often at a top of a company. Leadership exists all the way through the organization, in both domestic and global markets. Effective leaders work to optimize their teams and individuals within their teams; leadership seeks to integrate the entire hierarchy of leaders to optimize organization wide performance.
Most organizations believe that their competency-based leadership development once well- established would subsequently require cosmetic changes while the basic architecture shall remain the same. As products and services evolve with changing customer expectations, the essence and process of leadership development should also constantly undergo a change for the better. Competency is everchanging. Any Competency Management Concept is not a permanent cure that will magically solve all of the problems for ever. Hence organization should be treated as an unfinished prototype, which should be evolving and upgrading to better competency management framework that is difficult to imitate and will give a competitive advantage.
Source: (Dave Ulrich et all 2013, Global HR competencies) (A Daash et al, May 2020) (A Daash et al, May 2020) References
- Annjaan Daash, (2019) et al Competency based training design: focus on Leadership,
Icfai Business School; (May, 2019): 12- 18,
- Annjaan Daash et all, (May 2019) Competency Mapping of Marketing Agents Epra International Journal, Vol. 7, Pg 5-11
- A.H. Reilly, (2008). The role of human resource development competencies in facilitating effective crisis communication. Advances in Developing Human Resources, 10(3), 331–351.
- Dave Ulrich, Norm Smallwood, (2007) Leadership Brand: Harvard Business School, Harvard Business School Press, – Business & Economics – 270 pages
- D. Carr, (2000). Professionalism and Ethics in Teaching. London: Routledge.
- Ibrahim Abdelhamed Elshaer: Journal of Association of Arab Universities for Tourism and Hospitality, Special Issue, No.2, December 2013, 137-147, The Relationship between Managers’ Communication, Skills and Employees’ Job Satisfaction
- J. Pacevicius, & Kekyte. (2008). Managerial capacity: Analysis of possibilities and limitations. Economics and Management: Current Issues and Perspectives, 4(13), 50- 62.
- Lee, E.-S., Park, T.-Y., & Koo, B. (2015). Identifying organizational identification as a basis for attitudes and behaviors: A meta-analytic review. Psychological Bulletin, 141(5), 1049–1080.
- Lyle M. Spencer, Ph.D. Signe M. Spencer, (Apr’2008) Competence at Work Models for Superior Performance, Wiley India Pvt. Limited, 384 pages
- P. F Drucker, (1985). Innovation & Entrepreneurship: Practices and Principles. New York: Harper & Row
- McKinsey & Company, India Pharma (2020), Consolidated FDI Policy, July 2021)
- R. E Boyatzis, Stubbs, E., & Taylor, S. (2002). Learning cognitive and emotional intelligence competencies through graduate management education. Academy of Management Learning & Education, 1(2), 150-162.
- Sílvia Mayumi Takey, Marly Monteiro de Carvalho, (2015), Competency mapping in project management: An action research study in an engineering company, International Journal of Project Management, 33(4): 784-796,
- S. Rast, S. & A. Tourani (2012). Evaluation of employees’ job satisfaction and role of gender difference: An empirical study at airline industry in Iran. International Journal of Business and Social Science, 3(7), 92 – 100
- S. Sudhir, (2018, Rumors in organizational communication: A nightmare for hr managers. Human Resource Management International Digest, 26(5), 18–21.
- (Spencer & Spencer, 1993) R. E. Boyatzis, (2007). Developing Emotional Intelligence Competencies, (p. 28–52). Psychology Press,
- V. Zydziunaite, (2005). Teamwork Competencies and their research methodology
in nursing operationally monograph. Kaunsas: Judex.
- Xuejun Qiao, J. and Wang, W. (2009), “Managerial competencies for middle managers: some empirical findings from China”, Journal of European Industrial Training, Vol. 33 No. 1, pp. 69-81. https://doi.org/10.1108/03090590910924388
- Z. Atkociuniene (2010). Knowledge management information in improving the organization’s competencies. Information sciences, 21(5), 52 – 57.