
Written by, Prof. Suryamani Biswal
Standard deviation measures the spread or dispersion of a dataset around its mean. A low standard deviation indicates data points are clustered tightly around the mean, while a high standard deviation suggests data points are more spread out. It is a crucial statistical tool for data analysis, identifying variability, detecting outliers, and assessing risk in different fields.
Introduction
Data analysis plays a vital role in statistics, finance, economics, and social sciences. Understanding how data points deviate from the mean helps in making informed decisions. One key statistical measure for analyzing variability is the standard deviation. This article explores its definition, calculation, interpretation, and significance in data analysis.
What is Standard Deviation?

Standard deviation quantifies how much individual data points in a dataset deviate from the mean (average) value. It provides insight into data distribution:
- Low standard deviation: Data points are closely clustered around the mean, indicating minimal variability.
- High standard deviation: Data points are more spread out, indicating greater variability.
Why is Standard Deviation Important?
- Risk assessment: In finance, it helps measure the volatility of investments.
- Quality control: Businesses use it to ensure product consistency.
- Statistical accuracy: It helps researchers validate hypotheses and test data reliability.
- Decision making: Used in machine learning, economics, and social sciences for data-driven insights.
How to Calculate Standard Deviation
To compute standard deviation, follow these steps:
- Calculate the mean: Sum all data points and divide by the total number of values.
- Find the deviation: Subtract the mean from each data point.
- Square the deviations: This removes negative values and emphasizes larger deviations.
- Compute the variance: Find the mean of the squared deviations.
- Take the square root: The final step gives the standard deviation.
Standard Deviation Formulas
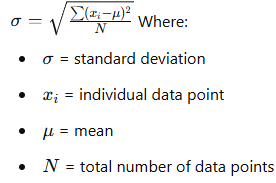
Population Standard Deviation:
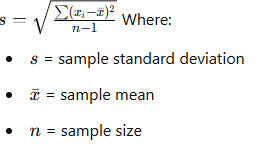
Why Use (n-1) in Sample Standard Deviation?
Dividing by (n-1) instead of n helps adjust for sample variability, ensuring a more accurate estimate of the population standard deviation.
Interpretation of Standard Deviation
| Standard Deviation | Interpretation |
|---|---|
| Low (close to 0) | Data points are tightly clustered around the mean. |
| Moderate | Some variability exists in the data. |
| High | Data points are widely spread out, indicating greater dispersion. |
Standard Deviation vs. Variance
| Measure | Definition | Units |
| Variance | Mean of squared deviations from the mean | Squared units |
| Standard Deviation | Square root of variance | Same as data |
Standard deviation is preferred over variance because it maintains the same unit as the original dataset, making it easier to interpret.
Applications of Standard Deviation in Different Fields
| Field | Application |
| Finance & Investment | Measures stock market volatility and risk. |
| Manufacturing & Quality Control | Ensures product consistency and defect detection. |
| Education & Research | Helps in performance analysis and grading systems. |
| Healthcare & Medicine | Analyzes clinical trials and patient data. |
| Machine Learning & AI | Used in feature scaling and model evaluation. |
Importance of Standard Deviation in Data Analysis
Identifying Outliers:
Standard deviation helps identify outliers, which are data points that significantly deviate from the mean. Outliers can affect the analysis, and understanding their presence is crucial for accurate interpretations.
Comparing Datasets:
The standard deviation allows for the comparison of variability between multiple datasets. Researchers can use it to assess differences in the spread of data points and make informed decisions based on the results.
Risk Assessment:
In finance and investment analysis, the standard deviation is a crucial measure for assessing risk. Higher standard deviations indicate higher volatility, which is a vital factor for making investment decisions.
Limitations of Standard Deviation
While standard deviation is a valuable measure, it has limitations:
It assumes a normal distribution: Standard deviation assumes that the data follows a normal distribution, which may not always be the case. In skewed or non-normal distributions, alternative measures may be more appropriate.
Sensitive to outliers: Outliers can significantly impact the standard deviation, making it less robust to extreme values. Median absolute deviation or other robust measures may be more suitable in such cases.
Conclusion
Standard deviation is a fundamental statistical measure used extensively in data analysis. Its calculation, interpretation, and significance make it a powerful tool for understanding the dispersion and variability within a dataset.
By considering the standard deviation, analysts can gain valuable insights into the data, identify outliers, compare datasets, and make informed decisions. However, it is important to be aware of its limitations and consider alternative measures when dealing with non-normal data or outliers.