

Written By, Dr. Hemant K. Panda || Professor and Principal
Abstract
Many researches addressed the importance of market segmentation. It has been proved that customer segments could be developed based on the perceived differences inproduct attributes evaluation. However, what makes the consumers perceive the attributes differently is rarely understood. The current study aims to relate the perceived differences in attribute evaluation because of the problem recognition styles associated with the consumer’s purchase decision process.
The perceptual maps produced by the Multi-dimensional Scaling procedure suggest that the perceived differences in attribute evaluations could be attributed to the way a consumer recognizes the need/problem. The attributes perceived vary between the problem recognition styles associated with the purchase process. Thus, marketers could benefit by creating effective marketing strategies and segments based on the problem recognition styles of the consumers.
Various types of market segmentation, including demographic, geographic, psychographic, and firmographic segmentation, play a crucial role in identifying and targeting the right customer segments. By understanding these aspects, businesses can develop customer-based strategies and enhance the benefits of market segmentation.
Index Terms – Problem recognition styles, product attributes, segmentation, Multidimensional scaling, Toilet soaps, demographic segmentation, geographic segmentation, psychographic segmentation, types of market segmentation, customer-based, benefits of market segmentation, customer segments, effective marketing, firmographic segmentation.
INTRODUCTION
Many studies suggest diverse methods and tools for segmenting markets. Additionally, the level of market segmentation required to achieve meaningful target audience marketing often depends on several factors. Specifically, elements such as the competitive landscape, the market’s velocity, and the breadth of the product line play a crucial role in determining the segmentation approach.. Market segmentation is the process of dividing the market into distinct groups to make more efficient use of marketing resources by tailoring messages, offers, and customer relationship management initiatives to customers who will be most responsive (Wyner, 2004).
Perceived Differences in Product Attributes and Market Segmentation
A unique approach suggested by Green (2000) is based on the perceived differences in the attributes. If the product attributes are perceived differently, then there is a scope for developing market segmentation based on those differences. Several researchers have addressed how consumers form preferences for various product-related attributes. The attribute preferences are developed by processing advertising messages (Smith 1991), high-motivation and low-motivation subjects (Maheswaran, Mackie, and Chaiken 1992), advertisement context (Yi 1993), what a person knows about company-corporate associations (Brown and Dacin 1997), and country of origin effects (Hong and Wyer 1990).
Moreover, attribute evaluation is moderated by the ability of consumers to generate reasons for and against choice alternatives (Chernev, 2001) and complex usage situations (Brucks, 1985). Sujan, Bettman, and Baumgartner (1993) found that when advertisements encourage the retrieval of autobiographical memories, there is a higher level of felt effect and reduced processing of product attributes.
The Five-Stage Purchase Decision Process
John Dewey first introduced the five-stage purchase decision process, which remains a central concept in consumer behavior, albeit to a limited extent. Despite the significance of problem recognition styles highlighted in earlier studies (Bruner, 1986; Bruner and Pomazal, 1988; Asugman and Cote, 1993; Workman and Studak, 2006), their role in the decision-making process often receives less attention. This study explores whether consumer groups perceive product attributes differently based on their problem recognition styles and, if so, how these differences can inform a market segmentation approach.
REVIEW OF EARLIER STUDIES
Market segmentation seeks to gain some competitive advantage by treating consumer groups differently. The advantages differ depending on the approach but include price differentiation, superior targeting, brand loyalty or retention, and strategic planning. Increasingly, marketers are employing cluster-based segmentation in the design and implementation of business strategy.
The Role of Segmentation in Marketing Strategy
Smith (1995) found that segmentation is driven by developments on the demand side of the market, allowing for a more precise alignment of products and marketing efforts with consumer needs. Additionally, Corner (2002) observed that segmentation serves as the foundation for a company’s Customer Relationship strategy. Furthermore, researchers suggest that an optimal segmentation scheme emerges from a process that combines approximately 50% science with 50% art and intuition.
Challenges in Market Segmentation
However, retaining the true number of segments is crucial because many managerial decisions on market segmentation, targeting, positioning, and the marketing mix are based on it (Andrews and Currim, 2004). Schultz (2002) attributed the failure of market segmentation to its static nature; once customers or prospects have been assigned to a segment, marketers think the task is done. However, there is a need for marketers to monitor the behavior of consumers in segments continuously.
Approaches to Market Segmentation
Various schemes for market segmentation have emerged in the literature, aiming to identify distinct consumer groups with homogeneous preferences or choice behaviors. Moreover, researchers extensively employ clustering methods in segmentations based on psychographics, benefit-seeking behaviors, or conjoint part-worths data (Krieger and Green, 1996). Additionally, Allenby and Ginter (1995) highlighted that “extreme respondents” have significant implications for product design and market segmentation decisions.
A classification of a sample of consumers into lifestyle segments is obtained by Wagner, Kamakura, and Wedel (1995) using a latent-class model. Wyner (2002) suggested (i) channel-based segmentation, (ii) line of business-based segmentation, and (iii) Customer needs and benefits-based segments.
Application of Segmentation in the Indian Market
Few researchers have addressed the dynamics of market segmentation in this study. Chandra and Ryans (2002) observed that gaining a strong foothold in the Indian market requires effective segmentation. Additionally, retired Procter & Gamble executive Helmut Meixner emphasized the importance of segmentation, stating that “Effective segmentation is critical to understanding and finding ways to market to the segment that the particular product appeals to.”
Thus, the current study aims to develop perceptual maps for the product attributes of the two consumer’s problem recognition styles using a multidimensional- scaling procedure. If the attributes are perceived differently by the two consumer problem recognition styles, (perceptual maps with differing positions for product attributes), then, based on the perceived differences, one can create market/consumer segments.
METHODOLOGY
This section summarizes a profile of the sample collected and the instruments used to collect the responses.
Data and Profile
The research team conducted a field survey in Kanchipuram district, located near Chennai, the capital of Tamil Nadu, India. Using a structured interview schedule, they contacted 686 respondents. The respondents shared their opinions on various product attributes of toilet soap brands and explained how they recognized the need for the product.
Among the 686 respondents, 372 (54.2%) were male, while 314 (45.8%) were female. Moreover, the mean monthly family income was INR 9,221 (σ = INR 7,342), and the average family size was 4.6 members (σ = 1.4). In terms of brand usage, 56.6% of respondents preferred popular segment brands, whereas 213 (31%) opted for premium segment brands. Meanwhile, the remaining respondents reported using economy segment brands. Additionally, the current brands had been used for a considerable duration, with an average of 5.59 years (σ = 5.29 years).
Measures
The scale for measuring consumers’ problem recognition styles consists of eight Likert-type items, rated on a seven-point scale. Notably, this scale, developed by Bruner (1986), demonstrates strong internal consistency with a reliability score of 0.90.
Moreover, the scale categorizes consumers into two groups: actual state (AS Type) and desired state (DS Type), based on the mean score of the eight items. Specifically, respondents scoring 3.5 or below were classified as ‘AS Type,’ whereas those scoring above 3.5 were designated as ‘DS Type.’ Consequently, this classification placed 269 respondents in the ‘AS Type’ category, while the remaining 417 were identified as ‘DS Type.’
The scale developed by Alpert and Kamins (1995) for multmulti-attributei- attribute attitude for measuring consumer memory and attitude towards pioneer and follower was adopted for measuring the product attributes related evaluations. The 16 contrasting adjective pairs, measured on a scale of -3 to +3, had a reported Cronbach’s alpha coefficient level of 0.78.. The scale has a reliability coefficient (Cronbach’s alpha) value of 0.796.
ANALYSIS AND RESULTS
Multidimensional scaling (MDS) attempts to identify the structure within a set of distance measures between objects or cases. Specifically, given a set of objects, the goal is to represent them in a low-dimensional space. Consequently, this solution is determined using the proximities between the objects.
Moreover, the purpose of this low-dimensional space is to uncover relationships among the objects. Additionally, by restricting the solution to a linear combination of independent variables, one may be able to interpret the dimensions of the solution in terms of these variables (SPSS).
The respondents were initially divided into two groups based on their scores on problem recognition styles. Subsequently, a multidimensional scaling algorithm was applied to evaluate 16 product attributes for each group separately. Moreover, this study utilizes the ALSCAL procedure in SPSS 12 (Alternating Least-Squares Algorithm) to perform Multi-Dimensional Scaling (MDS). Additionally, the iteration history for both groups was analyzed.
Table 2. Actual State Consumers: Stimulus Coordinates
| Iteration | S-stress | Improvement |
| 1 | 0.22961 | |
| 2 | 0.1734 | 0.05728 |
| 3 | 0.16448 | 0.00786 |
| 4 | 0.16256 | 0.00192 |
| 5 | 0.16226 | 0.00031 |
Young’s S-stress formula 1 is used. Iterations stopped because S-stress improvement is less than .001000
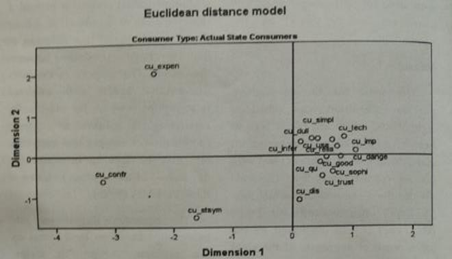
Figure 1. Derived Stimulus Configuration dimensional solutions (in squared distances) has been obtained. For the actual state consumers, the results are summarised below.
The RSQ value for fitted data is 0.92995. RSQ values are the proportion of variance of the scaled data
The partition disparities in the row, matrix, or entire data correspond to their respective distances. This indicates how well the MDS algorithm explains variance in the data. Notably, the procedure accounts for nearly 92% of the variance. Additionally, by applying Kruskal’s stress formula 1 (Kruskal, 1964), the computed stress value is 0.1838, signifying a fair fit for the data.
The results related to the desired state consumers are summarized below. The RSQ value for fitted data is 0.88957 and the stress value is 0.18711.
Comparison Between Actual and Desired State Consumers
For both actual state consumers and desired state consumers, a fair amount of variance in the data was accounted for by the MDS procedure. Additionally, significant differences were observed in how product attributes were perceived in relation to one another. For actual state consumers, most attributes were clustered together, forming a larger group. In contrast, multiple distinct groups of variables were evident for desired state consumers.
DISCUSSION
The two perceptual maps produced by the MDS procedure suggest the perceptual differences in product attributes evaluations between the consumer groups based on problem recognition styles. For actual state consumers, most of the product attributes (13 attributes out of 16) are
Table 2. Actual State Consumers: Stimulus Coordinates
| SI No. | Stimulus Name | Stimulus Name displayed in the M DS (Map) | Stimulus Coordinates Dimension | ||
| 1 | 2 | ||||
| 1 | High quality Poor quality | – | cu_qu | 0.4493 | – 0.1587 |
| 2 | Useless – Useful | cu_use | 0.6448 | 0.3658 | |
| 3 | Bad – Good | cu_good | 0.5520 | – 0.0404 | |
| 4 | Dangerous – Safe | cu_dange | 0.7891 | – 0.0287 | |
| 5 | Expensive Inexpensive | – | cu_expen | – 2.3180 | 2.0074 |
| 6 | Not a status symbol – Status symbol | cu_stsym | – 1.6165 | – 1.4825 | |
| 7 | Unreliable Reliable | – | cu_relia | 0.7282 | 0.2092 |
| 8 | Inferior Superior | – | cu_infer | 0.1253 | 0.3269 |
| 9 | Untrustworthy – Trustworthy | cu_trust | 0.4846 | – 0.4963 |
| 10 | Not very distinctive – Very distinctive | cu_dis | 0.1107 | – 1.0660 |
| 11 | Unimportant – Important | cu_imp | 1.0364 | 0.1132 |
| 12 | Conforming – Unconforming | cu_confr | – 3.1976 | – 0.6038 |
| 13 | Low tech – High tech | cu_tech | 0.8438 | 0.4424 |
| 14 | Complex – Simple | cu_simpl | 0.4067 | 0.3990 |
| 15 | Dull – Exciting | cu_dull | 0.3055 | 0.4070 |
| 16 | Unsophisticated – Sophisticated | cu_sophi | 0.6558 | – 0.3946 |
Moreover, three product attributes—status symbol, expensiveness, and conforming—were perceived distinctly from the others. This consumer group typically arrived at a solution based on the recognized need and aimed to derive pre-purchase satisfaction. Furthermore, they consolidated their decision as the best course of action by relating most attributes closely with each other.
On the other hand, four distinct clusters of product attributes are
Table 3. Iteration history for the 2-dimensional solutions -Desired State Consumers (In squared distances)
| Iteration | S-stress | Improvement |
| 1 | 0.21852 | |
| 2 | 0.17420 | 0.04432 |
| 3 | 0.17300 | 0.00121 |
| 4 | 0.17290 | 0.00010 |
Young’s S-stress formula 1 is used. Iterations stopped because -stress improvement is less than 0 .001000
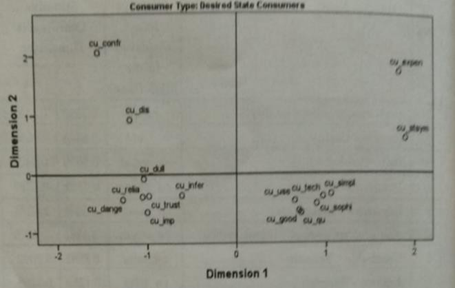
In Figure-2, the derived stimulus configuration is evident in the perceptual map for desired state consumers. Notably, consumers perceive attributes such as usefulness, goodness, simplicity, sophistication, technology, and quality together, forming a distinct cluster. Furthermore, they group attributes like dullness, reliability, and safety closely, indicating a strong perceived relationship among them.
importance, trust, and superiority form the second cluster. Toilet soaps as status symbol and expensiveness were found close to each other. Finally, distinctiveness and conforming form the fourth cluster. By highlighting the particular set of attributes, the marketers could gain more favourable attribute evaluation from the consumers and eventually deliver higher levels of satisfaction to the target market.
Distinct Evaluation of Attributes by Consumer Groups
The clustering effects of attributes provide strong evidence that consumer groups evaluate product attributes distinctly. Moreover, the need for the product, the importance or relevance of its attributes, and the overall evaluation suggest that marketers can benefit from understanding problem recognition styles.
Furthermore, previous research has shown that problem recognition styles are closely linked to information search efforts (Bruner, 1986). In addition, the current study provides further evidence that these styles play a significant role in product evaluation. More importantly, how product attributes are perceived in relation to each other serves as a crucial input for new product development decisions and communication mix strategies.
Problem Recognition Styles in Different Product Categories
Marketers must recognize that problem recognition varies by product category. For instance, a CD player purchase is driven by a desire for change, while essentials like salt and rice are bought when they run out. Toilet soaps are high-involvement products where brand choice influences repeat purchases. Despite this, promotions and advertisements remain effective in shaping consumer decisions. Identifying market segments based on problem recognition styles offers valuable insights into consumer behavior.
CONCLUSION
Segmentation has a long history in marketing. It starts with the notion that
Table-4: Desired State Consumers: Stimulus Coordinates
| SI No. | Stimulus Name | Stimulus Name displayed in the M DS (Map) | Stimulus Coordinates Dimension | ||
| 1 | 2 | ||||
| 1 | High quality – Poor quality | cu_qu | 0.9340 | – 0.5798 | |
| 2 | Useless – Useful | cu_use | 0.8433 | – 0.4242 | |
| 3 | Bad – Good | cu_good | 0.8973 | – 0.5508 | |
| 4 | Dangerous – Safe | cu_dange | – 1.3547 | – 0.3895 | |
| 5 | Expensive Inexpensive | – | cu_expen | 1.5912 | 1.3532 |
| 6 | Not a status symbol – Status symbol | cu_stsym | 1.6551 | 1.1185 | |
| 7 | Unreliable – Reliable | cu_relia | – 1.0440 | – 0.5726 | |
| 8 | Inferior – Superior | cu_infer | – 0.6021 | – 0.3391 | |
| 9 | Untrustworthy Trustworthy | – | cu_trust | – 1.0770 | – 0.3421 |
| 10 | Not very distinctive – Very distinctive | cu_dis | – 1.3526 | – 1.0034 | |
| 11 | Unimportant Important | – | cu_imp | 0.7251 | – 0.7644 |
| 12 | Conforming Unconforming | – | cu_confr | – 1.7014 | 1.8336 |
| 13 | Low tech – High tech | cu_tech | 1.1444 | – 0.3694 | |
| 14 | Complex – Simple | cu_simpl | 1.1744 | – 0.1881 | |
| 15 | Dull – Exciting | cu_dull | – 1.0498 | – 0.0440 | |
| 16 | Unsophisticated Sophisticated | – | cu_sophi | 0.9452 | – 0.4665 |
a company cannot be all things to all customers but must treat them differently based on knowledge of the
Moreover, if the target market is predominantly desired state consumers, then various marketing actions like driving the consumers to engage in novel thinking and promotional measures would deliver results that are more favourable.
LIMITATIONS
The study has been conducted in India, where socio- economic and cultural differences are highly pronounced. Greater amount of interpretations are possible, if the demographic variables are included in the analysis. Since the analysis envisaged to bring a macro analysis is perspective of the consumers, demographic variables are not included in the scope of the study. Further, the product category might play a significant role in problem recognition and evaluations. In the current study, toilet soap brands were used to collect consumer responses. That way the need or problem is recognized, and evaluations could vary if the chosen product category is of a higher risk (more expensive) or service.
FUTURE RESEARCH DIRECTIONS
Inclusion of demographic variables can provide proper explanations for the consumers’ behaviour and will be especially useful for the firms to develop the segments. Service sector, being in growth path, how the need for the services is recognized, and evaluation of attributes vary in service contexts could be a significant research
customer wants and the firm’s ability to deliver it profitably (Wyner 2002). The firms are highly benefited by effective segmentations; investment decisions are rationalized; it enables companies to allocate investment resources to target customers that will be most attracted to offers. The current study provides how the market segments could be developed based on the perceived differences of product attribute evaluations. The actual and desired state consumers perceive the attributes differently. This difference would be useful for the firms to develop segments. The segments based on consumer’s problem recognition styles would give solid foundation for the firms to develop various measures holistically. Since the problem recognition can occur and yet be placed on hold, marketers should understand how to minimize that possibility (Bruner and Pomazal, 1988).
interest to the various service providers in the country.
Since very few studies have addressed and related the significance of problem recognition with other stages of the decision-making, more of research works relating the problem recognition styles with various consumer behaviours would develop proper understanding about the consumer behaviour.
Market Segmentation and Consumer Behavior
- Allenby, G.M., & Ginter, J.L. (1995). Using Extremes to Design Products and Segment Markets. Journal of Marketing Research, 32 (4), 392-404.
- Andrews, R.L., & Currim, I.S. (2004). A Comparison of Segment Retention Criteria for Finite Mixture Logit Models. Journal of Marketing Research, 41 (3), 235-44..
- Krieger, A.M., & Green, P.E. (1996). Modifying Cluster-based Segments to Enhance Agreement with an Exogenous Response Variable. Journal of Marketing Research, 33 (3), 351-364.
- Schultz, D.E. (2002). Behavior Changes: Do Your Segments? Marketing News, 36 (15), 5-7.
- Smith, W.R. (1995). Product Differentiation and Market Segmentation as Alternative Marketing Strategies. Marketing Management, 4 (3), 63-66.
- Wagner A., Kamakura, W.A. & Wedel, M. (1995). Life-style segmentation with tailored interviewing. Journal of Marketing Research, 32 (3), 308-318.
Consumer Decision-Making and Perceptions
- Allport, F.H. & Kamins, M.A. (1995). An Empirical Investigation of Consumer Memory, Attitude, and Perceptions Toward Pioneer and Follower Brands. Journal of Marketing, 59, 34-45.
- Asugman, G. & Cote, J.A. (1993). Cognitive and Affective Decision-Making Preferences in Impulse Buying. Asian Journal of Marketing, 23-30.
- Brown, T.J. & Dacin, P.A. (1997). The Company and the Product: Corporate Associations and Consumer Product Responses. Journal of Marketing, 61 (1), 68-85.
- Chernev, A. (2001). The Impact of Common Features on Consumer Preferences: A Case of Confirmatory. Journal of Consumer Research, 27 (4), 475-489.
- Maheswaran, D., Diane M.M. & Chaiken, S. (1992). Brand Name as a Heuristic Cue: The Effects of Task Importance and Expectancy Confirmation on Consumer Judgments. Journal of Consumer Psychology, 1 (4), 317-36.
- Sujan, M., Bettman, J.R. & Baumgartner, H. (1993). Influencing Consumer Judgments Using Autobiographical Memories: A Self-referencing Perspective. Journal of Marketing Research, 30 (4), 422-437.
Consumer Search Behavior and Problem Recognition
- Brucks, M. (1985). The Effects of Product Class Knowledge on Information Search Behavior. Journal of Consumer Research, 12 (1), 1-16.
- Bruner II, G.C. (1986). Problem Recognition Styles and Search Patterns: An Empirical Investigation. Journal of Retailing, 62 (Fall), 281-297.
- Burner II, G.C. & Pomazal, R.J. (1988). Problem Recognition: The Crucial First Stage of the Consumer Decision Process. The Journal of Services Marketing, 2 (Summer), 43-53.
Advertising and Brand Communication
- Smith, R.A. (1991). The Effects of Visual and Verbal Advertising Information on Consumers’ Inferences. Journal of Advertising, 20 (4), 13-25.
- Yi, Y. (1993). Contextual Priming Effects in Print Advertisements: The Moderating Role of Prior Knowledge. Journal of Advertising, 22 (1), 1-10.
Customer Relationships and Marketing Strategies
- Corner, B.A. (2002). Measuring Customer Relationships. Marketing Management, 11 (3), 10-12.
- Wyner, G.A. (2002). Segmentation Architecture. Marketing Management, 11 (2), 6-8.
- Wyner, G.A. (2004). Pulling the Right Levers. Marketing Management, 13 (4), 8-10.
Market Trends and Economic Perspectives
- Chandra, A. & Ryans, J.K. (2002). Why India Now? Marketing Management, 11 (2), 43-45.
Product Evaluation and Consumer Preferences
- Green, P.E. (2000). Benefit Bundle Analysis. Journal of Advertising Research, 40 (6), 32-38.
- Hong, Sung-Tai & Wyer, R.S. (1990). Determinants of Product Evaluation: Effects of the Time Interval Between Knowledge of a Product’s Country of Origin and Information About Its Specific Attributes. Journal of Consumer Research, 17 (December), 277-88.
Quantitative Methods in Marketing Research
- Kruskal, J.B. (1964). Nonmetric Multidimensional Scaling: A Numerical Method. Psychometrika, 29, 115-129.
Fashion Consumer Behavior
- Workman, J.E., & Studak, C.M. (2006). Fashion Consumers and Fashion Recognition Styles. International Journal of Consumer Studies, 30 (January), 75-84.